| Business / Energy Data |
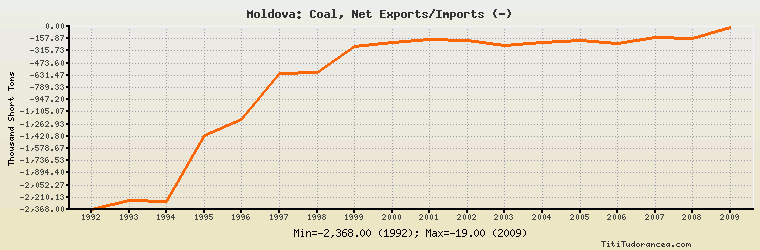
Moldova: Coal, Net Exports/Imports (-)
Thousand Short Tons
| Year | Moldova | Change, percent | Moldova, percent of Eurasia | Moldova, percent of World |
| 1992 | -2,368.000 | N/A | -7.999% | N/A |
| 1993 | -2,253.000 | -4.856% | -6.804% | N/A |
| 1994 | -2,262.000 | 0.399% | -8.913% | N/A |
| 1995 | -1,413.000 | -37.533% | -71.504% | N/A |
| 1996 | -1,198.000 | -15.216% | -56.539% | N/A |
| 1997 | -612.000 | -48.915% | -2.265% | N/A |
| 1998 | -593.200 | -3.072% | -2.246% | N/A |
| 1999 | -263.000 | -55.664% | -0.825% | N/A |
| 2000 | -211.000 | -19.772% | -0.517% | N/A |
| 2001 | -165.000 | -21.801% | -0.302% | N/A |
| 2002 | -176.000 | 6.667% | -0.429% | N/A |
| 2003 | -249.000 | 41.477% | -0.430% | N/A |
| 2004 | -207.000 | -16.867% | -0.319% | N/A |
| 2005 | -186.000 | -10.145% | -0.191% | N/A |
| 2006 | -214.000 | 15.054% | -0.226% | N/A |
| 2007 | -144.000 | -32.710% | -0.137% | N/A |
| 2008 | -151.000 | 4.861% | -0.145% | N/A |
| 2009 | -19.000 | -87.417% | -0.018% | N/A |
Historical Energy Data about Moldova
Total Consumption of Petroleum Products
Oil and Petroleum Products, Net Exports/Imports (-)
Dry Natural Gas Production
Dry Natural Gas Consumption
Dry Natural Gas, Net Exports/Imports (-)
Total Primary Coal Production
Total Coal Consumption
Coal, Net Exports/Imports (-)
Total Electricity Net Generation
Total Electricity Net Consumption
Total Electricity Exports
Total Electricity Imports
Electricity, Net Exports/Imports (-)
Total Conventional Thermal Electricity Net Generation
Hydroelectricity Net Generation
Total Primary Energy Production
Total Primary Energy Consumption
Total Carbon Dioxide Emissions from the Consumption of Energy
Population