| Business / Energy Data |
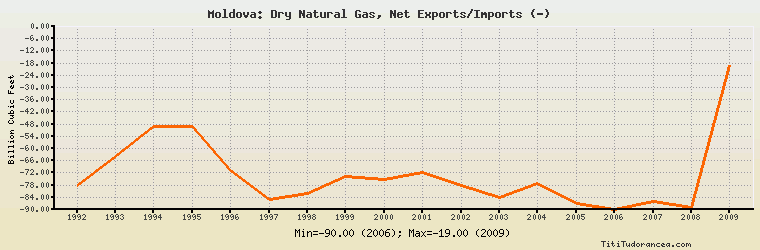
Moldova: Dry Natural Gas, Net Exports/Imports (-)
Billion Cubic Feet
| Year | Moldova | Change, percent | Moldova, percent of Eurasia | Moldova, percent of World |
| 1992 | -78.000 | N/A | -2.142% | N/A |
| 1993 | -64.000 | -17.949% | -1.817% | N/A |
| 1994 | -49.000 | -23.438% | -1.319% | N/A |
| 1995 | -49.000 | 0.000% | -1.162% | N/A |
| 1996 | -71.000 | 44.898% | -1.589% | N/A |
| 1997 | -85.000 | 19.718% | -2.076% | N/A |
| 1998 | -82.000 | -3.529% | -1.830% | N/A |
| 1999 | -74.000 | -9.756% | -1.582% | N/A |
| 2000 | -75.000 | 1.351% | -1.610% | N/A |
| 2001 | -72.000 | -4.000% | -1.450% | N/A |
| 2002 | -78.000 | 8.333% | -1.687% | N/A |
| 2003 | -84.000 | 7.692% | -1.841% | N/A |
| 2004 | -77.000 | -8.333% | -1.712% | N/A |
| 2005 | -87.000 | 12.987% | -1.738% | N/A |
| 2006 | -90.000 | 3.448% | -1.727% | N/A |
| 2007 | -86.000 | -4.444% | -1.660% | N/A |
| 2008 | -89.000 | 3.488% | -1.732% | N/A |
| 2009 | -19.000 | -78.652% | -0.381% | N/A |
Historical Energy Data about Moldova
Total Consumption of Petroleum Products
Oil and Petroleum Products, Net Exports/Imports (-)
Dry Natural Gas Production
Dry Natural Gas Consumption
Dry Natural Gas, Net Exports/Imports (-)
Total Primary Coal Production
Total Coal Consumption
Coal, Net Exports/Imports (-)
Total Electricity Net Generation
Total Electricity Net Consumption
Total Electricity Exports
Total Electricity Imports
Electricity, Net Exports/Imports (-)
Total Conventional Thermal Electricity Net Generation
Hydroelectricity Net Generation
Total Primary Energy Production
Total Primary Energy Consumption
Total Carbon Dioxide Emissions from the Consumption of Energy
Population