| Business / Energy Data |
Turkmenistan: Dry Natural Gas, Net Exports/Imports (-)
Billion Cubic Feet
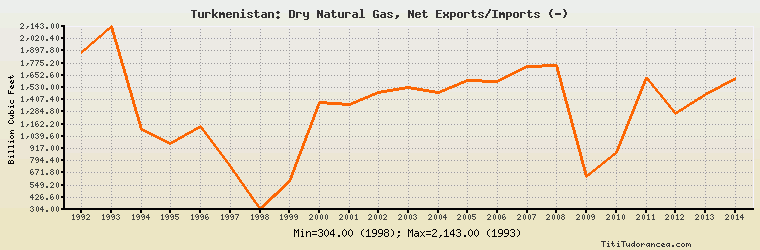
| Year | Turkmenistan | Change, percent | Turkmenistan, percent of Eurasia | Turkmenistan, percent of World |
| 1992 | 1,879.000 | N/A | 51.611% | N/A |
| 1993 | 2,143.000 | 14.050% | 60.839% | N/A |
| 1994 | 1,109.000 | -48.250% | 29.857% | N/A |
| 1995 | 971.000 | -12.444% | 23.017% | N/A |
| 1996 | 1,137.000 | 17.096% | 25.454% | N/A |
| 1997 | 739.000 | -35.004% | 18.050% | N/A |
| 1998 | 304.000 | -58.863% | 6.785% | N/A |
| 1999 | 590.000 | 94.079% | 12.610% | N/A |
| 2000 | 1,381.000 | 134.068% | 29.647% | N/A |
| 2001 | 1,363.000 | -1.303% | 27.449% | N/A |
| 2002 | 1,483.000 | 8.804% | 32.084% | N/A |
| 2003 | 1,533.000 | 3.372% | 33.590% | N/A |
| 2004 | 1,483.000 | -3.262% | 32.967% | N/A |
| 2005 | 1,596.000 | 7.620% | 31.887% | N/A |
| 2006 | 1,593.000 | -0.188% | 30.566% | N/A |
| 2007 | 1,744.000 | 9.479% | 33.672% | N/A |
| 2008 | 1,748.000 | 0.229% | 34.015% | N/A |
| 2009 | 639.000 | -63.444% | 12.809% | N/A |
| 2010 | 880.000 | 37.715% | 18.659% | N/A |
| 2011 | 1,628.000 | 85.000% | 25.429% | N/A |
| 2012 | 1,264.000 | -22.359% | 22.316% | N/A |
| 2013 | 1,458.000 | 15.348% | 21.817% | N/A |
| 2014 | 1,617.000 | 10.905% | 24.113% | N/A |
Historical Energy Data about Turkmenistan
Total Oil Supply
Total Consumption of Petroleum Products
Oil and Petroleum Products, Net Exports/Imports (-)
Production of Crude Oil including Lease Condensate
Crude Oil Proved Reserves
Dry Natural Gas Production
Dry Natural Gas Consumption
Dry Natural Gas, Net Exports/Imports (-)
Proved Reserves of Natural Gas
Total Coal Consumption
Coal, Net Exports/Imports (-)
Total Electricity Net Generation
Total Electricity Net Consumption
Total Electricity Exports
Total Electricity Imports
Electricity, Net Exports/Imports (-)
Total Conventional Thermal Electricity Net Generation
Hydroelectricity Net Generation
Total Primary Energy Production
Total Primary Energy Consumption
Total Carbon Dioxide Emissions from the Consumption of Energy
Population