| Business / Energy Data |
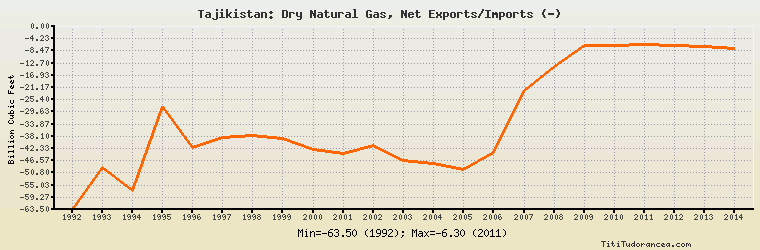
Tajikistan: Dry Natural Gas, Net Exports/Imports (-)
Billion Cubic Feet
| Year | Tajikistan | Change, percent | Tajikistan, percent of Eurasia | Tajikistan, percent of World |
| 1992 | -63.500 | N/A | -1.744% | N/A |
| 1993 | -49.000 | -22.835% | -1.391% | N/A |
| 1994 | -56.800 | 15.918% | -1.529% | N/A |
| 1995 | -27.600 | -51.408% | -0.654% | N/A |
| 1996 | -42.000 | 52.174% | -0.940% | N/A |
| 1997 | -38.600 | -8.095% | -0.943% | N/A |
| 1998 | -37.900 | -1.813% | -0.846% | N/A |
| 1999 | -38.900 | 2.639% | -0.831% | N/A |
| 2000 | -42.600 | 9.512% | -0.915% | N/A |
| 2001 | -44.200 | 3.756% | -0.890% | N/A |
| 2002 | -41.300 | -6.561% | -0.893% | N/A |
| 2003 | -46.600 | 12.833% | -1.021% | N/A |
| 2004 | -47.600 | 2.146% | -1.058% | N/A |
| 2005 | -49.600 | 4.202% | -0.991% | N/A |
| 2006 | -43.700 | -11.895% | -0.839% | N/A |
| 2007 | -22.300 | -48.970% | -0.431% | N/A |
| 2008 | -13.900 | -37.668% | -0.270% | N/A |
| 2009 | -6.700 | -51.799% | -0.134% | N/A |
| 2010 | -6.600 | -1.493% | -0.140% | N/A |
| 2011 | -6.300 | -4.545% | -0.098% | N/A |
| 2012 | -6.700 | 6.349% | -0.118% | N/A |
| 2013 | -7.000 | 4.478% | -0.105% | N/A |
| 2014 | -7.500 | 7.143% | -0.112% | N/A |
Historical Energy Data about Tajikistan
Total Oil Supply
Total Consumption of Petroleum Products
Oil and Petroleum Products, Net Exports/Imports (-)
Production of Crude Oil including Lease Condensate
Crude Oil Proved Reserves
Dry Natural Gas Production
Dry Natural Gas Consumption
Dry Natural Gas, Net Exports/Imports (-)
Proved Reserves of Natural Gas
Total Primary Coal Production
Total Coal Consumption
Coal, Net Exports/Imports (-)
Total Electricity Net Generation
Total Electricity Net Consumption
Total Electricity Exports
Total Electricity Imports
Electricity, Net Exports/Imports (-)
Total Conventional Thermal Electricity Net Generation
Hydroelectricity Net Generation
Total Primary Energy Production
Total Primary Energy Consumption
Total Carbon Dioxide Emissions from the Consumption of Energy
Population