| Business / Energy Data |
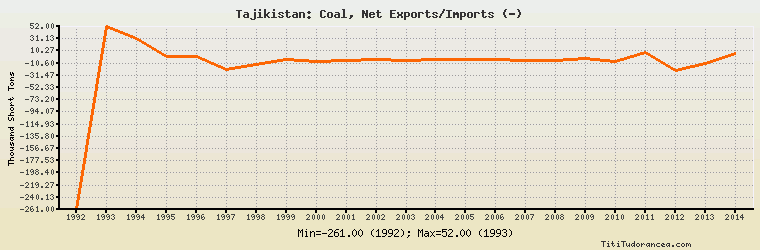
Tajikistan: Coal, Net Exports/Imports (-)
Thousand Short Tons
| Year | Tajikistan | Change, percent | Tajikistan, percent of Eurasia | Tajikistan, percent of World |
| 1992 | -261.000 | N/A | -0.882% | N/A |
| 1993 | 52.000 | -119.923% | 0.157% | N/A |
| 1994 | 31.000 | -40.385% | 0.122% | N/A |
| 1995 | 0.000 | -100.000% | 0.00% | N/A |
| 1996 | 0.000 | 0.000% | 0.00% | N/A |
| 1997 | -21.000 | 0.000% | -0.078% | N/A |
| 1998 | -13.000 | -38.095% | -0.049% | N/A |
| 1999 | -4.000 | -69.231% | -0.013% | N/A |
| 2000 | -8.000 | 100.000% | -0.020% | N/A |
| 2001 | -6.000 | -25.000% | -0.011% | N/A |
| 2002 | -5.000 | -16.667% | -0.012% | N/A |
| 2003 | -6.000 | 20.000% | -0.010% | N/A |
| 2004 | -5.000 | -16.667% | -0.008% | N/A |
| 2005 | -5.000 | 0.000% | -0.005% | N/A |
| 2006 | -4.000 | -20.000% | -0.004% | N/A |
| 2007 | -6.000 | 50.000% | -0.006% | N/A |
| 2008 | -7.000 | 16.667% | -0.007% | N/A |
| 2009 | -3.000 | -57.143% | -0.003% | N/A |
| 2010 | -8.000 | 166.667% | -0.007% | N/A |
| 2011 | 8.000 | -200.000% | 0.008% | N/A |
| 2012 | -24.000 | -400.000% | -0.018% | N/A |
| 2013 | -11.000 | -54.167% | -0.007% | N/A |
| 2014 | 6.000 | -154.545% | 0.004% | N/A |
Historical Energy Data about Tajikistan
Total Oil Supply
Total Consumption of Petroleum Products
Oil and Petroleum Products, Net Exports/Imports (-)
Production of Crude Oil including Lease Condensate
Crude Oil Proved Reserves
Dry Natural Gas Production
Dry Natural Gas Consumption
Dry Natural Gas, Net Exports/Imports (-)
Proved Reserves of Natural Gas
Total Primary Coal Production
Total Coal Consumption
Coal, Net Exports/Imports (-)
Total Electricity Net Generation
Total Electricity Net Consumption
Total Electricity Exports
Total Electricity Imports
Electricity, Net Exports/Imports (-)
Total Conventional Thermal Electricity Net Generation
Hydroelectricity Net Generation
Total Primary Energy Production
Total Primary Energy Consumption
Total Carbon Dioxide Emissions from the Consumption of Energy
Population