| Business / Energy Data |
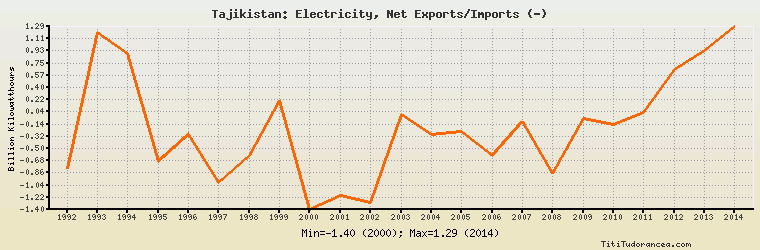
Tajikistan: Electricity, Net Exports/Imports (-)
Billion Kilowatthours
| Year | Tajikistan | Change, percent | Tajikistan, percent of Eurasia | Tajikistan, percent of World |
| 1992 | -0.800 | N/A | -7.169% | N/A |
| 1993 | 1.200 | -250.000% | 15.085% | N/A |
| 1994 | 0.900 | -25.000% | 6.752% | N/A |
| 1995 | -0.700 | -177.778% | -7.426% | N/A |
| 1996 | -0.300 | -57.143% | -2.786% | N/A |
| 1997 | -1.000 | 233.333% | -11.463% | N/A |
| 1998 | -0.600 | -40.000% | -5.772% | N/A |
| 1999 | 0.200 | -133.333% | 2.661% | N/A |
| 2000 | -1.400 | -800.000% | -22.131% | N/A |
| 2001 | -1.200 | -14.286% | -7.540% | N/A |
| 2002 | -1.300 | 8.333% | -17.128% | N/A |
| 2003 | 0.000 | -100.000% | 0.00% | N/A |
| 2004 | -0.300 | 0.000% | -1.653% | N/A |
| 2005 | -0.251 | -16.333% | -1.383% | N/A |
| 2006 | -0.609 | 142.629% | -3.196% | N/A |
| 2007 | -0.102 | -83.251% | -0.518% | N/A |
| 2008 | -0.876 | 758.824% | -4.204% | N/A |
| 2009 | -0.057 | -93.493% | -0.287% | N/A |
| 2010 | -0.146 | 156.140% | -0.772% | N/A |
| 2011 | 0.025 | -117.123% | 0.129% | N/A |
| 2012 | 0.661 | 2,544.000% | 3.423% | N/A |
| 2013 | 0.944 | 42.814% | 5.468% | N/A |
| 2014 | 1.293 | 36.970% | 10.695% | N/A |
Historical Energy Data about Tajikistan
Total Oil Supply
Total Consumption of Petroleum Products
Oil and Petroleum Products, Net Exports/Imports (-)
Production of Crude Oil including Lease Condensate
Crude Oil Proved Reserves
Dry Natural Gas Production
Dry Natural Gas Consumption
Dry Natural Gas, Net Exports/Imports (-)
Proved Reserves of Natural Gas
Total Primary Coal Production
Total Coal Consumption
Coal, Net Exports/Imports (-)
Total Electricity Net Generation
Total Electricity Net Consumption
Total Electricity Exports
Total Electricity Imports
Electricity, Net Exports/Imports (-)
Total Conventional Thermal Electricity Net Generation
Hydroelectricity Net Generation
Total Primary Energy Production
Total Primary Energy Consumption
Total Carbon Dioxide Emissions from the Consumption of Energy
Population