| Business / Energy Data |
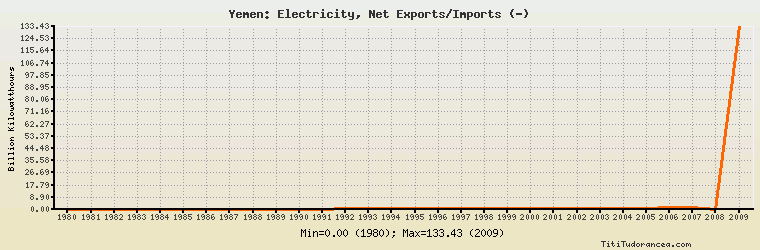
Yemen: Electricity, Net Exports/Imports (-)
Billion Kilowatthours
| Year | Yemen | Change, percent | Yemen, percent of Middle East | Yemen, percent of World |
| 1980 | 0.000 | N/A | - | N/A |
| 1981 | 0.034 | 0.000% | - | N/A |
| 1982 | 0.040 | 17.647% | - | N/A |
| 1983 | 0.059 | 47.500% | - | N/A |
| 1984 | 0.080 | 35.593% | - | N/A |
| 1985 | 0.072 | -10.000% | - | N/A |
| 1986 | 0.145 | 101.389% | 72.500% | N/A |
| 1987 | 0.124 | -14.483% | 74.699% | N/A |
| 1988 | 0.133 | 7.258% | 665.000% | N/A |
| 1989 | 0.133 | 0.000% | - | N/A |
| 1990 | 0.192 | 44.361% | - | N/A |
| 1991 | 0.330 | 71.875% | - | N/A |
| 1992 | 0.417 | 26.364% | - | N/A |
| 1993 | 0.488 | 17.026% | 252.850% | N/A |
| 1994 | 0.409 | -16.189% | 207.614% | N/A |
| 1995 | 0.513 | 25.428% | 326.752% | N/A |
| 1996 | 0.548 | 6.823% | 143.455% | N/A |
| 1997 | 0.664 | 21.168% | -167.677% | N/A |
| 1998 | 0.710 | 6.928% | -48.234% | N/A |
| 1999 | 0.897 | 26.338% | -126.695% | N/A |
| 2000 | 0.948 | 5.686% | -49.790% | N/A |
| 2001 | 1.030 | 8.650% | -57.930% | N/A |
| 2002 | 0.934 | -9.320% | -40.468% | N/A |
| 2003 | 0.978 | 4.711% | -33.539% | N/A |
| 2004 | 0.977 | -0.102% | -25.751% | N/A |
| 2005 | 1.075 | 10.031% | -46.943% | N/A |
| 2006 | 1.376 | 28.000% | -31.822% | N/A |
| 2007 | 1.532 | 11.337% | -37.977% | N/A |
| 2008 | 0.000 | -100.000% | 0.00% | N/A |
| 2009 | 133.426 | 0.000% | -4,174.781% | N/A |
Historical Energy Data about Yemen
Total Oil Supply
Total Consumption of Petroleum Products
Oil and Petroleum Products, Net Exports/Imports (-)
Production of Crude Oil including Lease Condensate
Crude Oil Proved Reserves
Dry Natural Gas, Net Exports/Imports (-)
Proved Reserves of Natural Gas
Coal, Net Exports/Imports (-)
Total Electricity Net Generation
Total Electricity Net Consumption
Electricity, Net Exports/Imports (-)
Total Conventional Thermal Electricity Net Generation
Total Primary Energy Production
Total Primary Energy Consumption
Total Carbon Dioxide Emissions from the Consumption of Energy
Population