| Business / Energy Data |
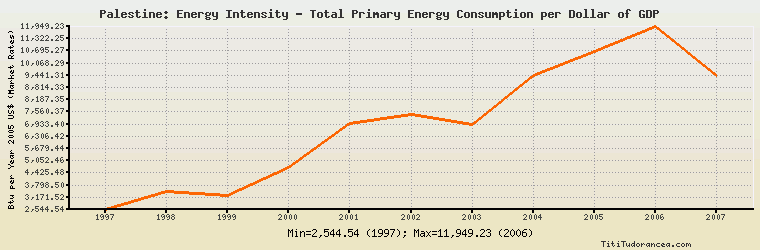
Palestine: Energy Intensity - Total Primary Energy Consumption per Dollar of GDP
Btu per Year 2005 U.S. Dollars (Market Exchange Rates)
| Year | Palestine | Change, percent | Palestine, percent of Middle East | Palestine, percent of World |
| 1980 | N/A | N/A | N/A | N/A |
| 1981 | N/A | N/A | N/A | N/A |
| 1982 | N/A | N/A | N/A | N/A |
| 1983 | N/A | N/A | N/A | N/A |
| 1984 | N/A | N/A | N/A | N/A |
| 1985 | N/A | N/A | N/A | N/A |
| 1986 | N/A | N/A | N/A | N/A |
| 1987 | N/A | N/A | N/A | N/A |
| 1988 | N/A | N/A | N/A | N/A |
| 1989 | N/A | N/A | N/A | N/A |
| 1990 | N/A | N/A | N/A | N/A |
| 1991 | N/A | N/A | N/A | N/A |
| 1992 | N/A | N/A | N/A | N/A |
| 1993 | N/A | N/A | N/A | N/A |
| 1994 | N/A | N/A | N/A | N/A |
| 1995 | N/A | N/A | N/A | N/A |
| 1996 | N/A | N/A | N/A | N/A |
| 1997 | 2,544.544 | N/A | 12.442% | 24.032% |
| 1998 | 3,488.010 | 37.078% | 17.118% | 33.606% |
| 1999 | 3,269.510 | -6.264% | 16.104% | 31.951% |
| 2000 | 4,725.023 | 44.518% | 23.570% | 47.185% |
| 2001 | 6,950.696 | 47.104% | 34.276% | 70.001% |
| 2002 | 7,443.176 | 7.085% | 35.431% | 74.587% |
| 2003 | 6,934.443 | -6.835% | 33.153% | 68.794% |
| 2004 | 9,434.994 | 36.060% | 45.847% | 92.332% |
| 2005 | 10,645.600 | 12.831% | 50.401% | 104.682% |
| 2006 | 11,949.226 | 12.246% | 58.113% | 119.552% |
| 2007 | 9,405.353 | -21.289% | 49.767% | 98.672% |
| 2008 | N/A | N/A | N/A | N/A |
| 2009 | N/A | N/A | N/A | N/A |
| 2010 | N/A | N/A | N/A | N/A |
Historical Energy Data about Palestine
Total Consumption of Petroleum Products
Oil and Petroleum Products, Net Exports/Imports (-)
Dry Natural Gas, Net Exports/Imports (-)
Total Coal Consumption
Coal, Net Exports/Imports (-)
Total Electricity Net Generation
Total Electricity Net Consumption
Total Electricity Imports
Electricity, Net Exports/Imports (-)
Total Conventional Thermal Electricity Net Generation
Total Primary Energy Consumption
Total Carbon Dioxide Emissions from the Consumption of Energy
Population