| Business / Energy Data |
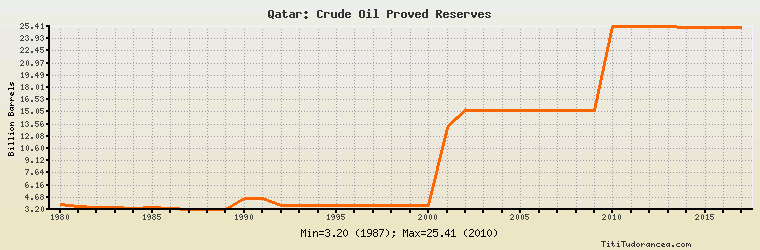
Qatar: Crude Oil Proved Reserves
Billion Barrels
| Year | Qatar | Change, percent | Qatar, percent of Middle East | Qatar, percent of World |
| 1980 | 3.800 | N/A | 1.051% | 0.592% |
| 1981 | 3.600 | -5.263% | 0.994% | 0.553% |
| 1982 | 3.400 | -5.556% | 0.936% | 0.508% |
| 1983 | 3.400 | 0.000% | 0.924% | 0.511% |
| 1984 | 3.300 | -2.941% | 0.892% | 0.495% |
| 1985 | 3.400 | 3.030% | 0.851% | 0.485% |
| 1986 | 3.300 | -2.941% | 0.831% | 0.472% |
| 1987 | 3.200 | -3.030% | 0.796% | 0.458% |
| 1988 | 3.200 | 0.000% | 0.566% | 0.360% |
| 1989 | 3.200 | 0.000% | 0.559% | 0.352% |
| 1990 | 4.500 | 40.625% | 0.681% | 0.449% |
| 1991 | 4.500 | 0.000% | 0.679% | 0.450% |
| 1992 | 3.700 | -17.778% | 0.559% | 0.396% |
| 1993 | 3.700 | 0.000% | 0.559% | 0.394% |
| 1994 | 3.700 | 0.000% | 0.558% | 0.393% |
| 1995 | 3.700 | 0.000% | 0.560% | 0.392% |
| 1996 | 3.700 | 0.000% | 0.561% | 0.389% |
| 1997 | 3.700 | 0.000% | 0.546% | 0.362% |
| 1998 | 3.700 | 0.000% | 0.545% | 0.362% |
| 1999 | 3.700 | 0.000% | 0.549% | 0.358% |
| 2000 | 3.700 | 0.000% | 0.548% | 0.363% |
| 2001 | 13.157 | 255.595% | 1.925% | 1.278% |
| 2002 | 15.207 | 15.581% | 2.218% | 1.472% |
| 2003 | 15.207 | 0.000% | 2.218% | 1.252% |
| 2004 | 15.207 | 0.000% | 2.092% | 1.201% |
| 2005 | 15.207 | 0.000% | 2.085% | 1.189% |
| 2006 | 15.207 | 0.000% | 2.059% | 1.180% |
| 2007 | 15.207 | 0.000% | 2.052% | 1.152% |
| 2008 | 15.207 | 0.000% | 2.046% | 1.145% |
| 2009 | 15.210 | 0.020% | 2.053% | 1.138% |
| 2010 | 25.410 | 67.061% | 3.376% | 1.873% |
| 2011 | 25.380 | -0.118% | 3.374% | 1.721% |
| 2012 | 25.380 | 0.000% | 3.194% | 1.666% |
| 2013 | 25.380 | 0.000% | 3.184% | 1.544% |
| 2014 | 25.240 | -0.552% | 3.161% | 1.529% |
| 2015 | 25.244 | 0.016% | 3.143% | 1.523% |
| 2016 | 25.244 | 0.000% | 3.145% | 1.529% |
| 2017 | 25.244 | 0.000% | 3.144% | N/A |
Historical Energy Data about Qatar
Total Oil Supply
Total Consumption of Petroleum Products
Oil and Petroleum Products, Net Exports/Imports (-)
Production of Crude Oil including Lease Condensate
Crude Oil Proved Reserves
Dry Natural Gas Production
Dry Natural Gas Consumption
Dry Natural Gas, Net Exports/Imports (-)
Proved Reserves of Natural Gas
Coal, Net Exports/Imports (-)
Total Electricity Net Generation
Total Electricity Net Consumption
Electricity, Net Exports/Imports (-)
Total Conventional Thermal Electricity Net Generation
Total Primary Energy Production
Total Primary Energy Consumption
Total Carbon Dioxide Emissions from the Consumption of Energy
Population