| Business / Energy Data |
Brunei: Crude Oil Distillation Capacity
Thousand Barrels Per Cal Day
| Year | Brunei | Change, percent | Brunei, percent of Asia & Oceania | Brunei, percent of World |
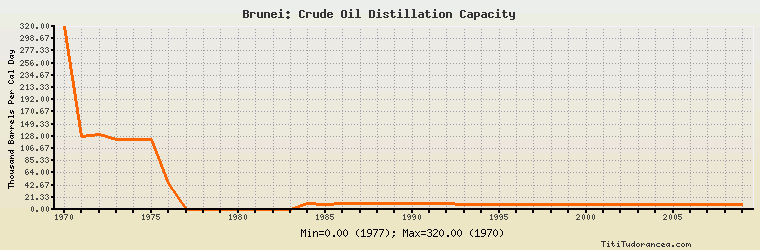
| 1970 | 320.000 | N/A | 5.466% | 0.684% |
| 1971 | 127.000 | -60.313% | 1.962% | 0.246% |
| 1972 | 131.000 | 3.150% | 1.791% | 0.239% |
| 1973 | 123.000 | -6.107% | 1.464% | 0.213% |
| 1974 | 123.000 | 0.000% | 1.292% | 0.196% |
| 1975 | 123.000 | 0.000% | 1.202% | 0.186% |
| 1976 | 45.000 | -63.415% | 0.414% | 0.065% |
| 1977 | 0.000 | -100.000% | 0.00% | 0.00% |
| 1978 | 0.000 | 0.000% | 0.00% | 0.00% |
| 1979 | 0.000 | 0.000% | 0.00% | 0.00% |
| 1980 | 0.000 | 0.000% | 0.00% | 0.00% |
| 1981 | 0.000 | 0.000% | 0.00% | 0.00% |
| 1982 | 0.000 | 0.000% | 0.00% | 0.00% |
| 1983 | 0.000 | 0.000% | 0.00% | 0.00% |
| 1984 | 10.000 | 0.000% | 0.079% | 0.014% |
| 1985 | 9.000 | -10.000% | 0.071% | 0.012% |
| 1986 | 10.000 | 11.111% | 0.081% | 0.014% |
| 1987 | 10.000 | 0.000% | 0.079% | 0.014% |
| 1988 | 10.000 | 0.000% | 0.080% | 0.014% |
| 1989 | 10.000 | 0.000% | 0.082% | 0.014% |
| 1990 | 10.000 | 0.000% | 0.082% | 0.014% |
| 1991 | 10.000 | 0.000% | 0.080% | 0.014% |
| 1992 | 10.000 | 0.000% | 0.076% | 0.013% |
| 1993 | 9.000 | -10.000% | 0.067% | 0.012% |
| 1994 | 9.000 | 0.000% | 0.066% | 0.012% |
| 1995 | 9.000 | 0.000% | 0.062% | 0.012% |
| 1996 | 9.000 | 0.000% | 0.061% | 0.012% |
| 1997 | 9.000 | 0.000% | 0.055% | 0.012% |
| 1998 | 9.000 | 0.000% | 0.053% | 0.012% |
| 1999 | 9.000 | 0.000% | 0.048% | 0.011% |
| 2000 | 9.000 | 0.000% | 0.046% | 0.011% |
| 2001 | 9.000 | 0.000% | 0.045% | 0.011% |
| 2002 | 9.000 | 0.000% | 0.045% | 0.011% |
| 2003 | 9.000 | 0.000% | 0.045% | 0.011% |
| 2004 | 9.000 | 0.000% | 0.045% | 0.011% |
| 2005 | 9.000 | 0.000% | 0.043% | 0.011% |
| 2006 | 9.000 | 0.000% | 0.041% | 0.011% |
| 2007 | 9.000 | 0.000% | 0.040% | 0.011% |
| 2008 | 9.000 | 0.000% | 0.041% | 0.011% |
| 2009 | 9.000 | 0.000% | 0.040% | 0.010% |
| 2010 | N/A | N/A | N/A | N/A |
Historical Energy Data about Brunei
Total Oil Supply
Total Consumption of Petroleum Products
Oil and Petroleum Products, Net Exports/Imports (-)
Production of Crude Oil including Lease Condensate
Crude Oil Proved Reserves
Dry Natural Gas Production
Dry Natural Gas Consumption
Dry Natural Gas, Net Exports/Imports (-)
Proved Reserves of Natural Gas
Total Coal Consumption
Coal, Net Exports/Imports (-)
Total Electricity Net Generation
Total Electricity Net Consumption
Electricity, Net Exports/Imports (-)
Total Conventional Thermal Electricity Net Generation
Total Primary Energy Production
Total Primary Energy Consumption
Total Carbon Dioxide Emissions from the Consumption of Energy
Population