| Business / Energy Data |
Uzbekistan: Total Oil Supply
Thousand Barrels Per Day
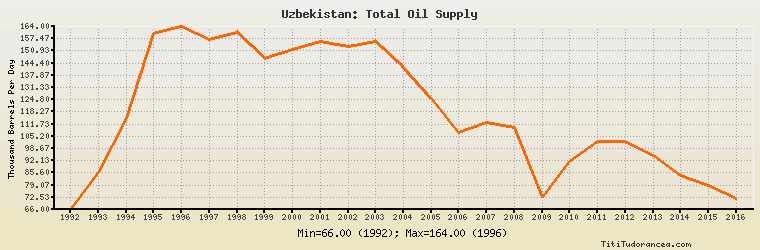
| Year | Uzbekistan | Change, percent | Uzbekistan, percent of Eurasia | Uzbekistan, percent of World |
| 1980 | N/A | N/A | N/A | N/A |
| 1981 | N/A | N/A | N/A | N/A |
| 1982 | N/A | N/A | N/A | N/A |
| 1983 | N/A | N/A | N/A | N/A |
| 1984 | N/A | N/A | N/A | N/A |
| 1985 | N/A | N/A | N/A | N/A |
| 1986 | N/A | N/A | N/A | N/A |
| 1987 | N/A | N/A | N/A | N/A |
| 1988 | N/A | N/A | N/A | N/A |
| 1989 | N/A | N/A | N/A | N/A |
| 1990 | N/A | N/A | N/A | N/A |
| 1991 | N/A | N/A | N/A | N/A |
| 1992 | 66.000 | N/A | 0.751% | 0.099% |
| 1993 | 86.000 | 30.303% | 1.093% | 0.128% |
| 1994 | 115.000 | 33.721% | 1.586% | 0.168% |
| 1995 | 160.000 | 39.130% | 2.240% | 0.228% |
| 1996 | 164.000 | 2.500% | 2.328% | 0.228% |
| 1997 | 157.000 | -4.268% | 2.176% | 0.212% |
| 1998 | 161.000 | 2.548% | 2.217% | 0.213% |
| 1999 | 147.000 | -8.696% | 1.924% | 0.196% |
| 2000 | 151.916 | 3.344% | 1.856% | 0.195% |
| 2001 | 156.044 | 2.717% | 1.779% | 0.201% |
| 2002 | 153.256 | -1.787% | 1.625% | 0.199% |
| 2003 | 155.996 | 1.788% | 1.496% | 0.196% |
| 2004 | 142.007 | -8.968% | 1.252% | 0.170% |
| 2005 | 125.333 | -11.742% | 1.065% | 0.147% |
| 2006 | 107.496 | -14.232% | 0.880% | 0.126% |
| 2007 | 112.495 | 4.650% | 0.887% | 0.132% |
| 2008 | 109.975 | -2.240% | 0.870% | 0.127% |
| 2009 | 72.409 | -34.159% | 0.556% | 0.084% |
| 2010 | 91.702 | 26.644% | 0.686% | 0.104% |
| 2011 | 102.677 | 11.968% | 0.761% | 0.116% |
| 2012 | 102.569 | -0.105% | 0.754% | 0.113% |
| 2013 | 94.738 | -7.635% | 0.687% | 0.104% |
| 2014 | 84.119 | -11.209% | 0.605% | 0.090% |
| 2015 | 78.870 | -6.240% | 0.559% | 0.081% |
| 2016 | 71.651 | -9.153% | 0.504% | 0.074% |
Historical Energy Data about Uzbekistan
Total Oil Supply
Total Consumption of Petroleum Products
Oil and Petroleum Products, Net Exports/Imports (-)
Production of Crude Oil including Lease Condensate
Crude Oil Proved Reserves
Dry Natural Gas Production
Dry Natural Gas Consumption
Dry Natural Gas, Net Exports/Imports (-)
Proved Reserves of Natural Gas
Total Primary Coal Production
Total Coal Consumption
Coal, Net Exports/Imports (-)
Total Recoverable Coal
Total Electricity Net Generation
Total Electricity Net Consumption
Total Electricity Exports
Total Electricity Imports
Electricity, Net Exports/Imports (-)
Total Conventional Thermal Electricity Net Generation
Hydroelectricity Net Generation
Total Primary Energy Production
Total Primary Energy Consumption
Total Carbon Dioxide Emissions from the Consumption of Energy
Population