| Business / Energy Data |
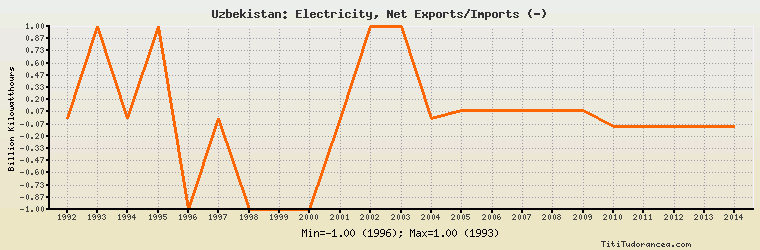
Uzbekistan: Electricity, Net Exports/Imports (-)
Billion Kilowatthours
| Year | Uzbekistan | Change, percent | Uzbekistan, percent of Eurasia | Uzbekistan, percent of World |
| 1992 | 0.000 | N/A | 0.00% | N/A |
| 1993 | 1.000 | 0.000% | 12.571% | N/A |
| 1994 | 0.000 | -100.000% | 0.00% | N/A |
| 1995 | 1.000 | 0.000% | 10.609% | N/A |
| 1996 | -1.000 | -200.000% | -9.285% | N/A |
| 1997 | 0.000 | -100.000% | 0.00% | N/A |
| 1998 | -1.000 | 0.000% | -9.620% | N/A |
| 1999 | -1.000 | 0.000% | -13.307% | N/A |
| 2000 | -1.000 | 0.000% | -15.808% | N/A |
| 2001 | 0.000 | -100.000% | 0.00% | N/A |
| 2002 | 1.000 | 0.000% | 13.175% | N/A |
| 2003 | 1.000 | 0.000% | 5.377% | N/A |
| 2004 | 0.000 | -100.000% | 0.00% | N/A |
| 2005 | 0.082 | 0.000% | 0.452% | N/A |
| 2006 | 0.085 | 3.659% | 0.446% | N/A |
| 2007 | 0.081 | -4.706% | 0.411% | N/A |
| 2008 | 0.083 | 2.469% | 0.398% | N/A |
| 2009 | 0.084 | 1.205% | 0.422% | N/A |
| 2010 | -0.088 | -204.762% | -0.465% | N/A |
| 2011 | -0.089 | 1.136% | -0.461% | N/A |
| 2012 | -0.089 | 0.000% | -0.461% | N/A |
| 2013 | -0.092 | 3.371% | -0.533% | N/A |
| 2014 | -0.094 | 2.174% | -0.778% | N/A |
Historical Energy Data about Uzbekistan
Total Oil Supply
Total Consumption of Petroleum Products
Oil and Petroleum Products, Net Exports/Imports (-)
Production of Crude Oil including Lease Condensate
Crude Oil Proved Reserves
Dry Natural Gas Production
Dry Natural Gas Consumption
Dry Natural Gas, Net Exports/Imports (-)
Proved Reserves of Natural Gas
Total Primary Coal Production
Total Coal Consumption
Coal, Net Exports/Imports (-)
Total Recoverable Coal
Total Electricity Net Generation
Total Electricity Net Consumption
Total Electricity Exports
Total Electricity Imports
Electricity, Net Exports/Imports (-)
Total Conventional Thermal Electricity Net Generation
Hydroelectricity Net Generation
Total Primary Energy Production
Total Primary Energy Consumption
Total Carbon Dioxide Emissions from the Consumption of Energy
Population