| Business / Energy Data |
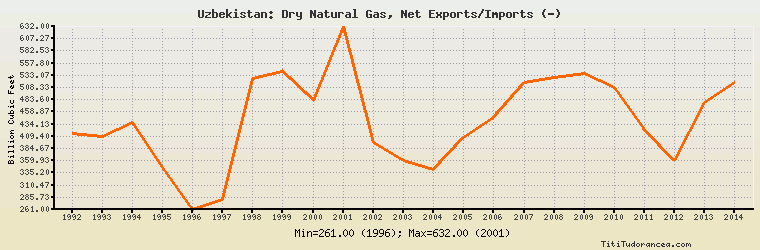
Uzbekistan: Dry Natural Gas, Net Exports/Imports (-)
Billion Cubic Feet
| Year | Uzbekistan | Change, percent | Uzbekistan, percent of Eurasia | Uzbekistan, percent of World |
| 1992 | 416.000 | N/A | 11.426% | N/A |
| 1993 | 409.000 | -1.683% | 11.611% | N/A |
| 1994 | 438.000 | 7.090% | 11.792% | N/A |
| 1995 | 346.000 | -21.005% | 8.202% | N/A |
| 1996 | 261.000 | -24.566% | 5.843% | N/A |
| 1997 | 282.000 | 8.046% | 6.888% | N/A |
| 1998 | 526.000 | 86.525% | 11.740% | N/A |
| 1999 | 541.000 | 2.852% | 11.562% | N/A |
| 2000 | 481.000 | -11.091% | 10.326% | N/A |
| 2001 | 632.000 | 31.393% | 12.728% | N/A |
| 2002 | 396.000 | -37.342% | 8.567% | N/A |
| 2003 | 360.000 | -9.091% | 7.888% | N/A |
| 2004 | 343.000 | -4.722% | 7.625% | N/A |
| 2005 | 406.000 | 18.367% | 8.112% | N/A |
| 2006 | 447.000 | 10.099% | 8.577% | N/A |
| 2007 | 519.000 | 16.107% | 10.020% | N/A |
| 2008 | 529.000 | 1.927% | 10.294% | N/A |
| 2009 | 537.000 | 1.512% | 10.765% | N/A |
| 2010 | 509.000 | -5.214% | 10.793% | N/A |
| 2011 | 424.000 | -16.699% | 6.623% | N/A |
| 2012 | 361.000 | -14.858% | 6.373% | N/A |
| 2013 | 477.000 | 32.133% | 7.138% | N/A |
| 2014 | 519.000 | 8.805% | 7.740% | N/A |
Historical Energy Data about Uzbekistan
Total Oil Supply
Total Consumption of Petroleum Products
Oil and Petroleum Products, Net Exports/Imports (-)
Production of Crude Oil including Lease Condensate
Crude Oil Proved Reserves
Dry Natural Gas Production
Dry Natural Gas Consumption
Dry Natural Gas, Net Exports/Imports (-)
Proved Reserves of Natural Gas
Total Primary Coal Production
Total Coal Consumption
Coal, Net Exports/Imports (-)
Total Recoverable Coal
Total Electricity Net Generation
Total Electricity Net Consumption
Total Electricity Exports
Total Electricity Imports
Electricity, Net Exports/Imports (-)
Total Conventional Thermal Electricity Net Generation
Hydroelectricity Net Generation
Total Primary Energy Production
Total Primary Energy Consumption
Total Carbon Dioxide Emissions from the Consumption of Energy
Population