| Business / Energy Data |
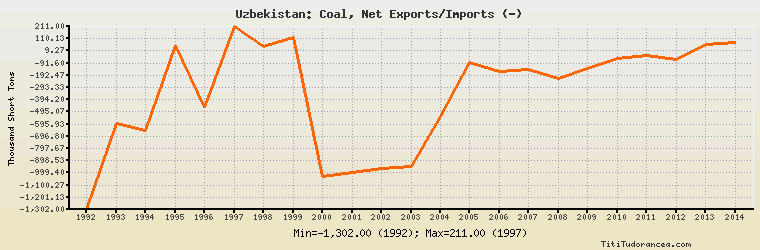
Uzbekistan: Coal, Net Exports/Imports (-)
Thousand Short Tons
| Year | Uzbekistan | Change, percent | Uzbekistan, percent of Eurasia | Uzbekistan, percent of World |
| 1992 | -1,302.000 | N/A | -4.398% | N/A |
| 1993 | -591.000 | -54.608% | -1.785% | N/A |
| 1994 | -648.000 | 9.645% | -2.553% | N/A |
| 1995 | 54.000 | -108.333% | 2.733% | N/A |
| 1996 | -459.000 | -950.000% | -21.662% | N/A |
| 1997 | 211.000 | -145.969% | 0.781% | N/A |
| 1998 | 43.000 | -79.621% | 0.163% | N/A |
| 1999 | 118.000 | 174.419% | 0.370% | N/A |
| 2000 | -1,027.000 | -970.339% | -2.517% | N/A |
| 2001 | -998.000 | -2.824% | -1.829% | N/A |
| 2002 | -964.000 | -3.407% | -2.348% | N/A |
| 2003 | -950.000 | -1.452% | -1.639% | N/A |
| 2004 | -529.000 | -44.316% | -0.815% | N/A |
| 2005 | -86.000 | -83.743% | -0.088% | N/A |
| 2006 | -160.000 | 86.047% | -0.169% | N/A |
| 2007 | -146.000 | -8.750% | -0.139% | N/A |
| 2008 | -215.000 | 47.260% | -0.207% | N/A |
| 2009 | -139.000 | -35.349% | -0.134% | N/A |
| 2010 | -52.000 | -62.590% | -0.045% | N/A |
| 2011 | -26.000 | -50.000% | -0.025% | N/A |
| 2012 | -59.000 | 126.923% | -0.044% | N/A |
| 2013 | 66.000 | -211.864% | 0.042% | N/A |
| 2014 | 79.000 | 19.697% | 0.048% | N/A |
Historical Energy Data about Uzbekistan
Total Oil Supply
Total Consumption of Petroleum Products
Oil and Petroleum Products, Net Exports/Imports (-)
Production of Crude Oil including Lease Condensate
Crude Oil Proved Reserves
Dry Natural Gas Production
Dry Natural Gas Consumption
Dry Natural Gas, Net Exports/Imports (-)
Proved Reserves of Natural Gas
Total Primary Coal Production
Total Coal Consumption
Coal, Net Exports/Imports (-)
Total Recoverable Coal
Total Electricity Net Generation
Total Electricity Net Consumption
Total Electricity Exports
Total Electricity Imports
Electricity, Net Exports/Imports (-)
Total Conventional Thermal Electricity Net Generation
Hydroelectricity Net Generation
Total Primary Energy Production
Total Primary Energy Consumption
Total Carbon Dioxide Emissions from the Consumption of Energy
Population