| Business / Exchange Rates |
USD to IDR Exchange Rates:
(US Dollar to Indonesian Rupiah)
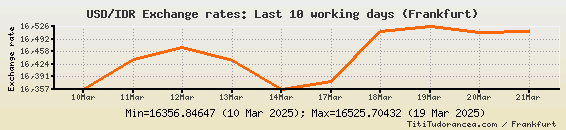
Last 10 working days
Last 30 days
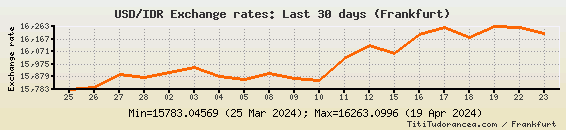
Thursday, April 25th: A 20.99543 gain brought the USD/IDR quotation to 16189.49627.
Monday, April 22nd - Wednesday, April 24th: The pair went down for three consecutive trading days, reaching the level of 16168.50084 on Wednesday, April 24th.
Friday, April 19th: A limited increase brought the currency pair to 16263.0996, the highest level in four years.
Thursday, April 18th: A drop of 72.60021 brought the US dollar to Indonesian rupiah quotation to 16181.00009.
Tuesday, April 16th - Wednesday, April 17th: The currency pair climbed for two consecutive trading days, up to 16253.6003 from 16058.3521.
Monday, April 15th: A drop of 62.4515 brought the quote to 16058.3521.
Friday, April 12th: A second consecutive addition brought the currency pair to 16120.8036.
Thursday, April 11th: The decline of the Indonesian rupiah against the US dollar restarted; the USD/IDR exchange rate gained to 16021.90325.
Tuesday, April 9th - Wednesday, April 10th: The pair decreased for two consecutive trading days, reaching the level of 15849.40147 on Wednesday, April 10th.
Monday, April 8th: A slight increase brought the USD/IDR quotation to 15908.39878.
Friday, April 5th: The ![]() went down again. A 21.30042 loss brought the
went down again. A 21.30042 loss brought the ![]() to 15858.89678.
to 15858.89678.
Thursday, April 4th: The Indonesian rupiah started to rise again against the US currency; the USD/IDR exchange ![]() went down to 15880.1972.
went down to 15880.1972.
Tuesday, April 2nd - Wednesday, April 3rd: The rate climbed for two trading days in a row, reaching the level of 15948.04785 Indonesian rupiah to the US dollar on Wednesday, April 3rd.
Thursday, March 28th: A small loss of 26.25243 brought the USD/IDR cross to 15870.75201.
Tuesday, March 26th - Wednesday, March 27th: The rate increased by a total of 113.95875, from 15783.04569 to 15897.00444.
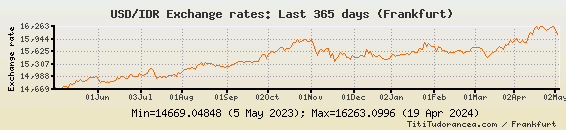
Last 365 days
USD/IDR Exchange rate - Historical data:
| Date: | Exchange rate: |
| 2024-04-25 | 16189.49627 |
| 2024-04-24 | 16168.50084 |
| 2024-04-23 | 16210.05246 |
| 2024-04-22 | 16252.6994 |
| 2024-04-19 | 16263.0996 |
| 2024-04-18 | 16181.00009 |
| 2024-04-17 | 16253.6003 |
| 2024-04-16 | 16202.04945 |
| 2024-04-15 | 16058.3521 |
| 2024-04-12 | 16120.8036 |
| 2024-04-11 | 16021.90325 |
| 2024-04-10 | 15849.40147 |
| 2024-04-09 | 15867.35069 |
| 2024-04-08 | 15908.39878 |
| 2024-04-05 | 15858.89678 |
| 2024-04-04 | 15880.1972 |
| 2024-04-03 | 15948.04785 |
| 2024-04-02 | 15911.60108 |
| 2024-03-28 | 15870.75201 |
| 2024-03-27 | 15897.00444 |
| 2024-03-26 | 15798.8024 |
| 2024-03-25 | 15783.04569 |
| 2024-03-22 | 15810.5978 |
| 2024-03-21 | 15670.79857 |
| 2024-03-20 | 15736.99742 |
| 2024-03-19 | 15744.89589 |
| 2024-03-18 | 15718.94969 |
| 2024-03-15 | 15617.90305 |
| 2024-03-14 | 15597.90389 |
| 2024-03-13 | 15576.45123 |
| 2024-03-12 | 15521.09747 |
| 2024-03-11 | 15486.84789 |
| 2024-03-08 | 15531.89718 |
| 2024-03-07 | 15638.54979 |
| 2024-03-06 | 15697.5538 |
| 2024-03-05 | 15743.10075 |
| 2024-03-04 | 15737.84805 |
| 2024-03-01 | 15721.89957 |
| 2024-02-29 | 15738.20432 |
| 2024-02-28 | 15713.453 |
| 2024-02-27 | 15637.54606 |
| 2024-02-26 | 15630.79617 |
| 2024-02-23 | 15606.30423 |
| 2024-02-22 | 15588.70343 |
| 2024-02-21 | 15625.65455 |
| 2024-02-20 | 15660.45177 |
| 2024-02-19 | 15646.10245 |
| 2024-02-16 | 15636.49703 |
| 2024-02-15 | 15605.90152 |
| 2024-02-14 | 15604.54588 |
| 2024-02-13 | 15611.99852 |
| 2024-02-12 | 15587.65432 |
| 2024-02-09 | 15636.90123 |
| 2024-02-08 | 15656.64622 |
| 2024-02-07 | 15658.60245 |
| 2024-02-06 | 15739.9516 |
| 2024-02-05 | 15760.64582 |
| 2024-02-02 | 15632.197 |
| 2024-02-01 | 15766.34918 |
| 2024-01-31 | 15757.39596 |
| 2024-01-30 | 15778.14863 |
| 2024-01-29 | 15824.75284 |
| 2024-01-26 | 15759.30457 |
| 2024-01-25 | 15851.05113 |
| 2024-01-24 | 15687.35442 |
| 2024-01-23 | 15711.10191 |
The cross rates on this page are based on the Reference Exchange Rates published by the European Central Bank.
The reference rates are averages of buying and selling rates against the euro, calculated according to the daily concertation procedure between central banks within and outside the European System of Central Banks, by paying due attention to ensuring that the published exchange rates reflect the market conditions prevailing at the time of the daily concertation procedure.
Actual market transactions are affected by a number of factors, such as location and type of transaction (buying or selling), and might be carried at different rates. This data is released for reference purposes only.