| Business / Energy Data |
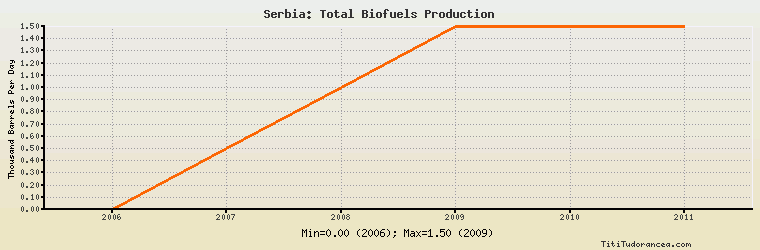
Serbia: Total Biofuels Production
Thousand Barrels Per Day
| Year | Serbia | Change, percent | Serbia, percent of Europe | Serbia, percent of World |
| 2000 | N/A | N/A | N/A | N/A |
| 2001 | N/A | N/A | N/A | N/A |
| 2002 | N/A | N/A | N/A | N/A |
| 2003 | N/A | N/A | N/A | N/A |
| 2004 | N/A | N/A | N/A | N/A |
| 2005 | N/A | N/A | N/A | N/A |
| 2006 | 0.000 | N/A | 0.00% | 0.00% |
| 2007 | 0.500 | 0.000% | 0.324% | 0.045% |
| 2008 | 1.000 | 100.000% | 0.507% | 0.066% |
| 2009 | 1.500 | 50.000% | 0.644% | N/A |
| 2010 | 1.500 | 0.000% | 0.740% | N/A |
| 2011 | 1.500 | 0.000% | 0.549% | N/A |
Historical Energy Data about Serbia
Total Oil Supply
Total Consumption of Petroleum Products
Oil and Petroleum Products, Net Exports/Imports (-)
Production of Crude Oil including Lease Condensate
Crude Oil Proved Reserves
Dry Natural Gas, Net Exports/Imports (-)
Proved Reserves of Natural Gas
Total Primary Coal Production
Total Coal Consumption
Coal, Net Exports/Imports (-)
Electricity, Net Exports/Imports (-)
Total Biofuels Production
Total Biofuels Consumption
Total Primary Energy Production
Total Primary Energy Consumption