| Business / Energy Data |
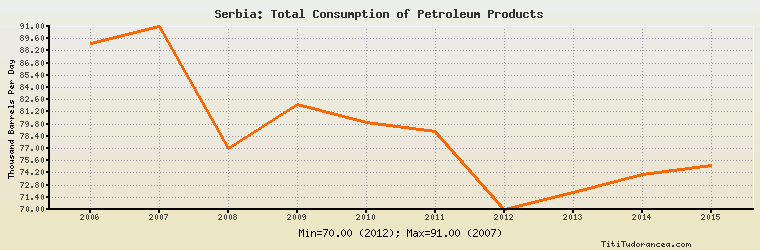
Serbia: Total Consumption of Petroleum Products
Thousand Barrels Per Day
| Year | Serbia | Change, percent | Serbia, percent of Europe | Serbia, percent of World |
| 1980 | N/A | N/A | N/A | N/A |
| 1981 | N/A | N/A | N/A | N/A |
| 1982 | N/A | N/A | N/A | N/A |
| 1983 | N/A | N/A | N/A | N/A |
| 1984 | N/A | N/A | N/A | N/A |
| 1985 | N/A | N/A | N/A | N/A |
| 1986 | N/A | N/A | N/A | N/A |
| 1987 | N/A | N/A | N/A | N/A |
| 1988 | N/A | N/A | N/A | N/A |
| 1989 | N/A | N/A | N/A | N/A |
| 1990 | N/A | N/A | N/A | N/A |
| 1991 | N/A | N/A | N/A | N/A |
| 1992 | N/A | N/A | N/A | N/A |
| 1993 | N/A | N/A | N/A | N/A |
| 1994 | N/A | N/A | N/A | N/A |
| 1995 | N/A | N/A | N/A | N/A |
| 1996 | N/A | N/A | N/A | N/A |
| 1997 | N/A | N/A | N/A | N/A |
| 1998 | N/A | N/A | N/A | N/A |
| 1999 | N/A | N/A | N/A | N/A |
| 2000 | N/A | N/A | N/A | N/A |
| 2001 | N/A | N/A | N/A | N/A |
| 2002 | N/A | N/A | N/A | N/A |
| 2003 | N/A | N/A | N/A | N/A |
| 2004 | N/A | N/A | N/A | N/A |
| 2005 | N/A | N/A | N/A | N/A |
| 2006 | 89.000 | N/A | 0.542% | 0.104% |
| 2007 | 91.000 | 2.247% | 0.561% | 0.105% |
| 2008 | 77.000 | -15.385% | 0.477% | 0.090% |
| 2009 | 82.000 | 6.494% | 0.534% | 0.096% |
| 2010 | 80.000 | -2.439% | 0.520% | 0.090% |
| 2011 | 79.000 | -1.250% | 0.530% | 0.088% |
| 2012 | 70.000 | -11.392% | 0.486% | 0.077% |
| 2013 | 72.000 | 2.857% | 0.505% | 0.078% |
| 2014 | 74.000 | 2.778% | 0.522% | 0.079% |
| 2015 | 75.000 | 1.351% | 0.522% | 0.079% |
Historical Energy Data about Serbia
Total Oil Supply
Total Consumption of Petroleum Products
Oil and Petroleum Products, Net Exports/Imports (-)
Production of Crude Oil including Lease Condensate
Crude Oil Proved Reserves
Dry Natural Gas, Net Exports/Imports (-)
Proved Reserves of Natural Gas
Total Primary Coal Production
Total Coal Consumption
Coal, Net Exports/Imports (-)
Electricity, Net Exports/Imports (-)
Total Biofuels Production
Total Biofuels Consumption
Total Primary Energy Production
Total Primary Energy Consumption