| Business / Energy Data |
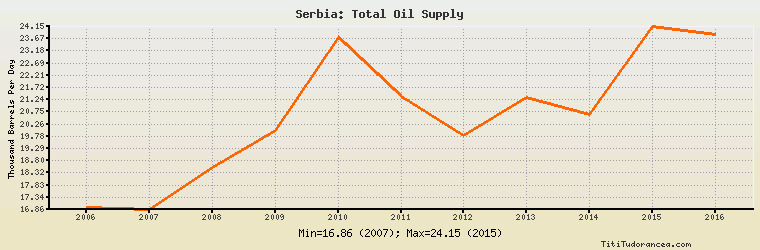
Serbia: Total Oil Supply
Thousand Barrels Per Day
| Year | Serbia | Change, percent | Serbia, percent of Europe | Serbia, percent of World |
| 1980 | N/A | N/A | N/A | N/A |
| 1981 | N/A | N/A | N/A | N/A |
| 1982 | N/A | N/A | N/A | N/A |
| 1983 | N/A | N/A | N/A | N/A |
| 1984 | N/A | N/A | N/A | N/A |
| 1985 | N/A | N/A | N/A | N/A |
| 1986 | N/A | N/A | N/A | N/A |
| 1987 | N/A | N/A | N/A | N/A |
| 1988 | N/A | N/A | N/A | N/A |
| 1989 | N/A | N/A | N/A | N/A |
| 1990 | N/A | N/A | N/A | N/A |
| 1991 | N/A | N/A | N/A | N/A |
| 1992 | N/A | N/A | N/A | N/A |
| 1993 | N/A | N/A | N/A | N/A |
| 1994 | N/A | N/A | N/A | N/A |
| 1995 | N/A | N/A | N/A | N/A |
| 1996 | N/A | N/A | N/A | N/A |
| 1997 | N/A | N/A | N/A | N/A |
| 1998 | N/A | N/A | N/A | N/A |
| 1999 | N/A | N/A | N/A | N/A |
| 2000 | N/A | N/A | N/A | N/A |
| 2001 | N/A | N/A | N/A | N/A |
| 2002 | N/A | N/A | N/A | N/A |
| 2003 | N/A | N/A | N/A | N/A |
| 2004 | N/A | N/A | N/A | N/A |
| 2005 | N/A | N/A | N/A | N/A |
| 2006 | 16.948 | N/A | 0.293% | 0.020% |
| 2007 | 16.857 | -0.537% | 0.310% | 0.020% |
| 2008 | 18.512 | 9.818% | 0.354% | 0.021% |
| 2009 | 19.991 | 7.989% | 0.401% | 0.023% |
| 2010 | 23.697 | 18.538% | 0.509% | 0.027% |
| 2011 | 21.377 | -9.790% | 0.496% | 0.024% |
| 2012 | 19.822 | -7.274% | 0.496% | 0.022% |
| 2013 | 21.321 | 7.562% | 0.559% | 0.023% |
| 2014 | 20.663 | -3.086% | 0.536% | 0.022% |
| 2015 | 24.154 | 16.895% | 0.601% | 0.025% |
| 2016 | 23.825 | -1.362% | 0.585% | 0.025% |
Historical Energy Data about Serbia
Total Oil Supply
Total Consumption of Petroleum Products
Oil and Petroleum Products, Net Exports/Imports (-)
Production of Crude Oil including Lease Condensate
Crude Oil Proved Reserves
Dry Natural Gas, Net Exports/Imports (-)
Proved Reserves of Natural Gas
Total Primary Coal Production
Total Coal Consumption
Coal, Net Exports/Imports (-)
Electricity, Net Exports/Imports (-)
Total Biofuels Production
Total Biofuels Consumption
Total Primary Energy Production
Total Primary Energy Consumption