| Business / Energy Data |
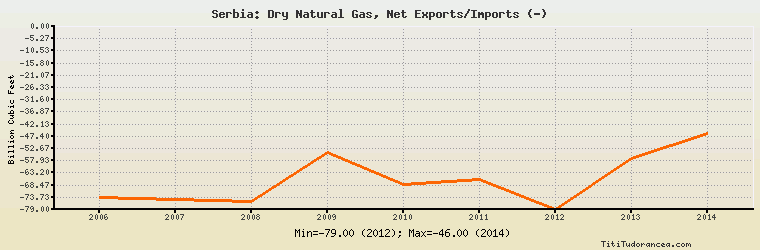
Serbia: Dry Natural Gas, Net Exports/Imports (-)
Billion Cubic Feet
| Year | Serbia | Change, percent | Serbia, percent of Europe | Serbia, percent of World |
| 2006 | -73.900 | N/A | 0.827% | N/A |
| 2007 | -74.500 | 0.812% | 0.819% | N/A |
| 2008 | -75.500 | 1.342% | 0.822% | N/A |
| 2009 | -54.300 | -28.079% | 0.640% | N/A |
| 2010 | -68.000 | 25.230% | 0.707% | N/A |
| 2011 | -66.000 | -2.941% | 0.714% | N/A |
| 2012 | -79.000 | 19.697% | 0.934% | N/A |
| 2013 | -57.000 | -27.848% | 0.673% | N/A |
| 2014 | -46.000 | -19.298% | 0.612% | N/A |
Historical Energy Data about Serbia
Total Oil Supply
Total Consumption of Petroleum Products
Oil and Petroleum Products, Net Exports/Imports (-)
Production of Crude Oil including Lease Condensate
Crude Oil Proved Reserves
Dry Natural Gas, Net Exports/Imports (-)
Proved Reserves of Natural Gas
Total Primary Coal Production
Total Coal Consumption
Coal, Net Exports/Imports (-)
Electricity, Net Exports/Imports (-)
Total Biofuels Production
Total Biofuels Consumption
Total Primary Energy Production
Total Primary Energy Consumption