| Business / Energy Data |
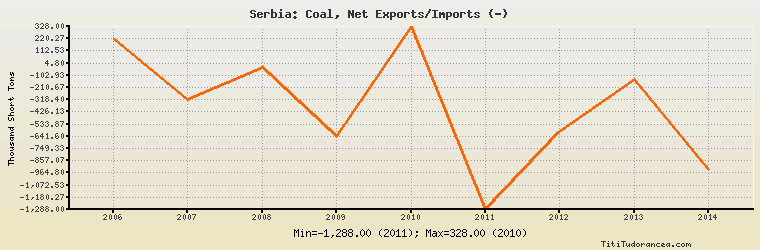
Serbia: Coal, Net Exports/Imports (-)
Thousand Short Tons
| Year | Serbia | Change, percent | Serbia, percent of Europe | Serbia, percent of World |
| 2006 | 222.000 | N/A | -0.086% | N/A |
| 2007 | -314.000 | -241.441% | 0.116% | N/A |
| 2008 | -33.000 | -89.490% | 0.014% | N/A |
| 2009 | -645.000 | 1,854.545% | 0.324% | N/A |
| 2010 | 328.000 | -150.853% | -0.143% | N/A |
| 2011 | -1,288.000 | -492.683% | 0.534% | N/A |
| 2012 | -596.000 | -53.727% | 0.232% | N/A |
| 2013 | -138.000 | -76.846% | 0.053% | N/A |
| 2014 | -933.000 | 576.087% | 0.376% | N/A |
Historical Energy Data about Serbia
Total Oil Supply
Total Consumption of Petroleum Products
Oil and Petroleum Products, Net Exports/Imports (-)
Production of Crude Oil including Lease Condensate
Crude Oil Proved Reserves
Dry Natural Gas, Net Exports/Imports (-)
Proved Reserves of Natural Gas
Total Primary Coal Production
Total Coal Consumption
Coal, Net Exports/Imports (-)
Electricity, Net Exports/Imports (-)
Total Biofuels Production
Total Biofuels Consumption
Total Primary Energy Production
Total Primary Energy Consumption