| Business / Energy Data |
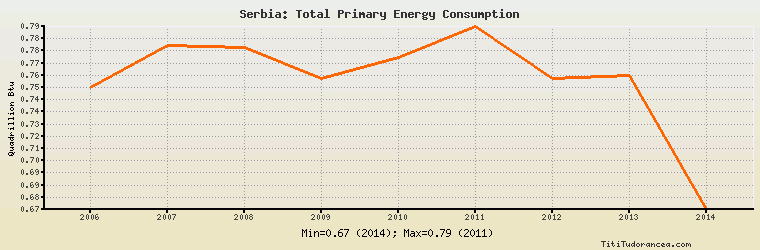
Serbia: Total Primary Energy Consumption
Quadrillion Btu
| Year | Serbia | Change, percent | Serbia, percent of Europe | Serbia, percent of World |
| 1980 | N/A | N/A | N/A | N/A |
| 1981 | N/A | N/A | N/A | N/A |
| 1982 | N/A | N/A | N/A | N/A |
| 1983 | N/A | N/A | N/A | N/A |
| 1984 | N/A | N/A | N/A | N/A |
| 1985 | N/A | N/A | N/A | N/A |
| 1986 | N/A | N/A | N/A | N/A |
| 1987 | N/A | N/A | N/A | N/A |
| 1988 | N/A | N/A | N/A | N/A |
| 1989 | N/A | N/A | N/A | N/A |
| 1990 | N/A | N/A | N/A | N/A |
| 1991 | N/A | N/A | N/A | N/A |
| 1992 | N/A | N/A | N/A | N/A |
| 1993 | N/A | N/A | N/A | N/A |
| 1994 | N/A | N/A | N/A | N/A |
| 1995 | N/A | N/A | N/A | N/A |
| 1996 | N/A | N/A | N/A | N/A |
| 1997 | N/A | N/A | N/A | N/A |
| 1998 | N/A | N/A | N/A | N/A |
| 1999 | N/A | N/A | N/A | N/A |
| 2000 | N/A | N/A | N/A | N/A |
| 2001 | N/A | N/A | N/A | N/A |
| 2002 | N/A | N/A | N/A | N/A |
| 2003 | N/A | N/A | N/A | N/A |
| 2004 | N/A | N/A | N/A | N/A |
| 2005 | N/A | N/A | N/A | N/A |
| 2006 | 0.752 | N/A | 0.881% | 0.161% |
| 2007 | 0.780 | 3.723% | 0.919% | 0.163% |
| 2008 | 0.779 | -0.128% | 0.916% | 0.160% |
| 2009 | 0.758 | -2.696% | 0.940% | 0.157% |
| 2010 | 0.772 | 1.847% | 0.925% | 0.152% |
| 2011 | 0.793 | 2.720% | 0.976% | 0.152% |
| 2012 | 0.758 | -4.414% | 0.940% | 0.142% |
| 2013 | 0.760 | 0.264% | 0.950% | 0.140% |
| 2014 | 0.669 | -11.974% | 0.862% | 0.123% |
Historical Energy Data about Serbia
Total Oil Supply
Total Consumption of Petroleum Products
Oil and Petroleum Products, Net Exports/Imports (-)
Production of Crude Oil including Lease Condensate
Crude Oil Proved Reserves
Dry Natural Gas, Net Exports/Imports (-)
Proved Reserves of Natural Gas
Total Primary Coal Production
Total Coal Consumption
Coal, Net Exports/Imports (-)
Electricity, Net Exports/Imports (-)
Total Biofuels Production
Total Biofuels Consumption
Total Primary Energy Production
Total Primary Energy Consumption