| Business / Energy Data |
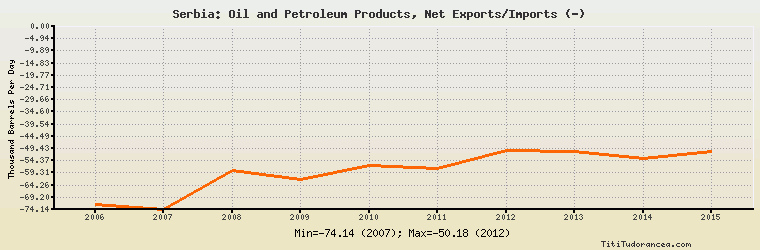
Serbia: Oil and Petroleum Products, Net Exports/Imports (-)
Thousand Barrels Per Day
| Year | Serbia | Change, percent | Serbia, percent of Europe | Serbia, percent of World |
| 2006 | -72.052 | N/A | 0.676% | N/A |
| 2007 | -74.143 | 2.902% | 0.687% | N/A |
| 2008 | -58.488 | -21.115% | 0.535% | N/A |
| 2009 | -62.009 | 6.020% | 0.597% | N/A |
| 2010 | -56.303 | -9.202% | 0.525% | N/A |
| 2011 | -57.623 | 2.344% | 0.544% | N/A |
| 2012 | -50.178 | -12.920% | 0.482% | N/A |
| 2013 | -50.679 | 0.998% | 0.485% | N/A |
| 2014 | -53.337 | 5.245% | 0.517% | N/A |
| 2015 | -50.846 | -4.670% | 0.491% | N/A |
Historical Energy Data about Serbia
Total Oil Supply
Total Consumption of Petroleum Products
Oil and Petroleum Products, Net Exports/Imports (-)
Production of Crude Oil including Lease Condensate
Crude Oil Proved Reserves
Dry Natural Gas, Net Exports/Imports (-)
Proved Reserves of Natural Gas
Total Primary Coal Production
Total Coal Consumption
Coal, Net Exports/Imports (-)
Electricity, Net Exports/Imports (-)
Total Biofuels Production
Total Biofuels Consumption
Total Primary Energy Production
Total Primary Energy Consumption