| Business / Energy Data |
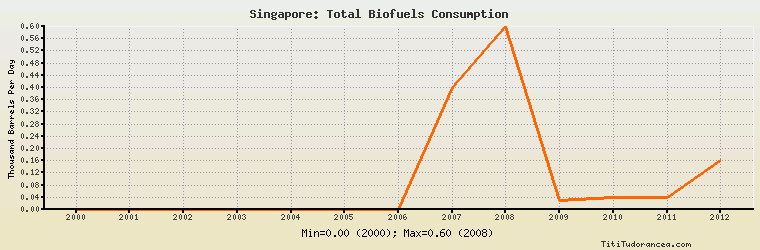
Singapore: Total Biofuels Consumption
Thousand Barrels Per Day
| Year | Singapore | Change, percent | Singapore, percent of Asia & Oceania | Singapore, percent of World |
| 2000 | 0.000 | N/A | 0.00% | 0.00% |
| 2001 | 0.000 | 0.000% | 0.00% | 0.00% |
| 2002 | 0.000 | 0.000% | 0.00% | 0.00% |
| 2003 | 0.000 | 0.000% | 0.00% | 0.00% |
| 2004 | 0.000 | 0.000% | 0.00% | 0.00% |
| 2005 | 0.000 | 0.000% | 0.00% | 0.00% |
| 2006 | 0.000 | 0.000% | 0.00% | 0.00% |
| 2007 | 0.400 | 0.000% | 0.874% | 0.040% |
| 2008 | 0.600 | 50.000% | 0.881% | 0.044% |
| 2009 | 0.030 | -95.000% | 0.035% | N/A |
| 2010 | 0.040 | 33.333% | 0.042% | N/A |
| 2011 | 0.040 | 0.000% | 0.037% | N/A |
| 2012 | 0.160 | 300.000% | 0.122% | N/A |
Historical Energy Data about Singapore
Total Oil Supply
Total Consumption of Petroleum Products
Oil and Petroleum Products, Net Exports/Imports (-)
Dry Natural Gas Consumption
Dry Natural Gas, Net Exports/Imports (-)
Total Coal Consumption
Coal, Net Exports/Imports (-)
Total Electricity Net Generation
Total Electricity Net Consumption
Total Electricity Exports
Total Electricity Imports
Electricity, Net Exports/Imports (-)
Total Conventional Thermal Electricity Net Generation
Total Biofuels Production
Total Biofuels Consumption
Total Primary Energy Consumption
Total Carbon Dioxide Emissions from the Consumption of Energy
Population