| Business / Energy Data |
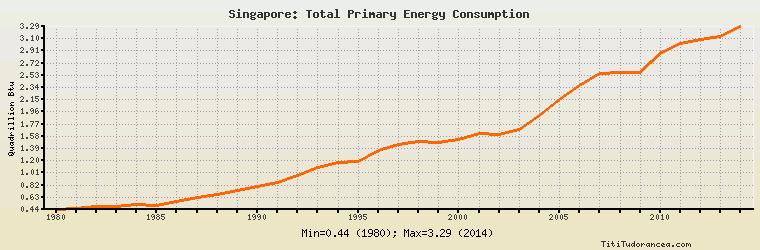
Singapore: Total Primary Energy Consumption
Quadrillion Btu
| Year | Singapore | Change, percent | Singapore, percent of Asia & Oceania | Singapore, percent of World |
| 1980 | 0.442 | N/A | 0.939% | 0.156% |
| 1981 | 0.463 | 4.751% | 0.977% | 0.166% |
| 1982 | 0.490 | 5.832% | 1.019% | 0.176% |
| 1983 | 0.487 | -0.612% | 0.982% | 0.172% |
| 1984 | 0.514 | 5.544% | 0.964% | 0.173% |
| 1985 | 0.498 | -3.113% | 0.903% | 0.163% |
| 1986 | 0.572 | 14.859% | 1.002% | 0.183% |
| 1987 | 0.633 | 10.664% | 1.057% | 0.196% |
| 1988 | 0.676 | 6.793% | 1.052% | 0.202% |
| 1989 | 0.732 | 8.284% | 1.105% | 0.215% |
| 1990 | 0.804 | 9.836% | 1.093% | 0.231% |
| 1991 | 0.860 | 6.965% | 1.167% | 0.249% |
| 1992 | 0.974 | 13.256% | 1.275% | 0.283% |
| 1993 | 1.088 | 11.704% | 1.337% | 0.312% |
| 1994 | 1.172 | 7.721% | 1.367% | 0.333% |
| 1995 | 1.190 | 1.536% | 1.293% | 0.329% |
| 1996 | 1.356 | 13.950% | 1.413% | 0.366% |
| 1997 | 1.455 | 7.301% | 1.492% | 0.390% |
| 1998 | 1.504 | 3.368% | 1.539% | 0.400% |
| 1999 | 1.490 | -0.931% | 1.456% | 0.389% |
| 2000 | 1.526 | 2.416% | 1.427% | 0.386% |
| 2001 | 1.621 | 6.225% | 1.486% | 0.409% |
| 2002 | 1.602 | -1.172% | 1.407% | 0.396% |
| 2003 | 1.692 | 5.618% | 1.372% | 0.404% |
| 2004 | 1.903 | 12.470% | 1.414% | 0.434% |
| 2005 | 2.161 | 13.558% | 1.481% | 0.477% |
| 2006 | 2.371 | 9.718% | 1.523% | 0.508% |
| 2007 | 2.564 | 8.140% | 1.555% | 0.535% |
| 2008 | 2.576 | 0.468% | 1.527% | 0.530% |
| 2009 | 2.578 | 0.078% | 1.459% | 0.535% |
| 2010 | 2.869 | 11.288% | 1.505% | 0.564% |
| 2011 | 3.023 | 5.368% | 1.497% | 0.579% |
| 2012 | 3.087 | 2.117% | 1.459% | 0.579% |
| 2013 | 3.131 | 1.425% | 1.438% | 0.577% |
| 2014 | 3.290 | 5.078% | 1.496% | 0.603% |
Historical Energy Data about Singapore
Total Oil Supply
Total Consumption of Petroleum Products
Oil and Petroleum Products, Net Exports/Imports (-)
Dry Natural Gas Consumption
Dry Natural Gas, Net Exports/Imports (-)
Total Coal Consumption
Coal, Net Exports/Imports (-)
Total Electricity Net Generation
Total Electricity Net Consumption
Total Electricity Exports
Total Electricity Imports
Electricity, Net Exports/Imports (-)
Total Conventional Thermal Electricity Net Generation
Total Biofuels Production
Total Biofuels Consumption
Total Primary Energy Consumption
Total Carbon Dioxide Emissions from the Consumption of Energy
Population