| Business / Energy Data |
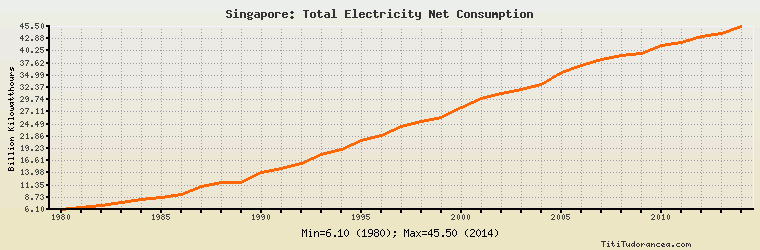
Singapore: Total Electricity Net Consumption
Billion Kilowatthours
| Year | Singapore | Change, percent | Singapore, percent of Asia & Oceania | Singapore, percent of World |
| 1980 | 6.100 | N/A | 0.526% | 0.083% |
| 1981 | 6.500 | 6.557% | 0.546% | 0.088% |
| 1982 | 6.900 | 6.154% | 0.554% | 0.091% |
| 1983 | 7.600 | 10.145% | 0.574% | 0.097% |
| 1984 | 8.200 | 7.895% | 0.578% | 0.098% |
| 1985 | 8.700 | 6.098% | 0.582% | 0.100% |
| 1986 | 9.400 | 8.046% | 0.595% | 0.106% |
| 1987 | 11.000 | 17.021% | 0.642% | 0.119% |
| 1988 | 12.000 | 9.091% | 0.649% | 0.124% |
| 1989 | 12.000 | 0.000% | 0.608% | 0.118% |
| 1990 | 14.000 | 16.667% | 0.659% | 0.135% |
| 1991 | 15.000 | 7.143% | 0.666% | 0.142% |
| 1992 | 16.000 | 6.667% | 0.675% | 0.150% |
| 1993 | 18.000 | 12.500% | 0.717% | 0.166% |
| 1994 | 19.000 | 5.556% | 0.693% | 0.171% |
| 1995 | 21.000 | 10.526% | 0.728% | 0.183% |
| 1996 | 22.000 | 4.762% | 0.731% | 0.186% |
| 1997 | 24.000 | 9.091% | 0.755% | 0.198% |
| 1998 | 25.000 | 4.167% | 0.764% | 0.201% |
| 1999 | 26.000 | 4.000% | 0.771% | 0.205% |
| 2000 | 28.000 | 7.692% | 0.781% | 0.211% |
| 2001 | 30.000 | 7.143% | 0.795% | 0.222% |
| 2002 | 31.000 | 3.333% | 0.772% | 0.222% |
| 2003 | 32.000 | 3.226% | 0.742% | 0.221% |
| 2004 | 33.000 | 3.125% | 0.699% | 0.218% |
| 2005 | 35.624 | 7.952% | 0.705% | 0.227% |
| 2006 | 37.011 | 3.893% | 0.671% | 0.226% |
| 2007 | 38.484 | 3.980% | 0.637% | 0.224% |
| 2008 | 39.201 | 1.863% | 0.630% | 0.225% |
| 2009 | 39.634 | 1.105% | 0.609% | 0.228% |
| 2010 | 41.415 | 4.494% | 0.574% | 0.222% |
| 2011 | 42.159 | 1.796% | 0.541% | 0.218% |
| 2012 | 43.338 | 2.797% | 0.536% | 0.220% |
| 2013 | 44.072 | 1.694% | 0.512% | 0.217% |
| 2014 | 45.502 | 3.245% | 0.509% | 0.220% |
Historical Energy Data about Singapore
Total Oil Supply
Total Consumption of Petroleum Products
Oil and Petroleum Products, Net Exports/Imports (-)
Dry Natural Gas Consumption
Dry Natural Gas, Net Exports/Imports (-)
Total Coal Consumption
Coal, Net Exports/Imports (-)
Total Electricity Net Generation
Total Electricity Net Consumption
Total Electricity Exports
Total Electricity Imports
Electricity, Net Exports/Imports (-)
Total Conventional Thermal Electricity Net Generation
Total Biofuels Production
Total Biofuels Consumption
Total Primary Energy Consumption
Total Carbon Dioxide Emissions from the Consumption of Energy
Population