| Business / Energy Data |
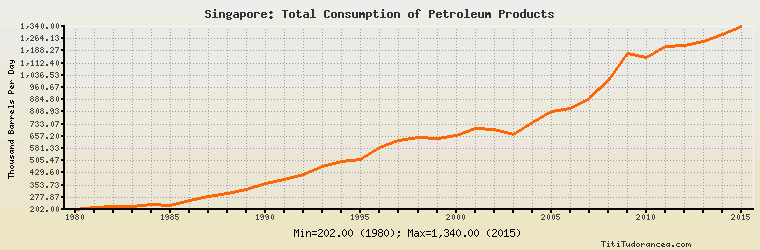
Singapore: Total Consumption of Petroleum Products
Thousand Barrels Per Day
| Year | Singapore | Change, percent | Singapore, percent of Asia & Oceania | Singapore, percent of World |
| 1980 | 202.000 | N/A | 1.887% | 0.322% |
| 1981 | 214.000 | 5.941% | 2.007% | 0.351% |
| 1982 | 222.000 | 3.738% | 2.131% | 0.373% |
| 1983 | 220.000 | -0.901% | 2.126% | 0.374% |
| 1984 | 235.000 | 6.818% | 2.180% | 0.393% |
| 1985 | 227.000 | -3.404% | 2.116% | 0.378% |
| 1986 | 257.000 | 13.216% | 2.318% | 0.416% |
| 1987 | 285.000 | 10.895% | 2.480% | 0.452% |
| 1988 | 304.000 | 6.667% | 2.461% | 0.468% |
| 1989 | 329.000 | 8.224% | 2.504% | 0.498% |
| 1990 | 363.000 | 10.334% | 2.631% | 0.546% |
| 1991 | 389.000 | 7.163% | 2.698% | 0.579% |
| 1992 | 420.000 | 7.969% | 2.764% | 0.624% |
| 1993 | 469.000 | 11.667% | 2.932% | 0.694% |
| 1994 | 503.000 | 7.249% | 2.953% | 0.730% |
| 1995 | 512.000 | 1.789% | 2.861% | 0.730% |
| 1996 | 586.000 | 14.453% | 3.125% | 0.818% |
| 1997 | 630.000 | 7.509% | 3.228% | 0.858% |
| 1998 | 650.000 | 3.175% | 3.376% | 0.877% |
| 1999 | 643.000 | -1.077% | 3.175% | 0.848% |
| 2000 | 660.000 | 2.644% | 3.168% | 0.856% |
| 2001 | 708.000 | 7.273% | 3.376% | 0.911% |
| 2002 | 698.000 | -1.412% | 3.244% | 0.890% |
| 2003 | 668.000 | -4.298% | 2.971% | 0.834% |
| 2004 | 746.000 | 11.677% | 3.125% | 0.897% |
| 2005 | 809.000 | 8.445% | 3.323% | 0.956% |
| 2006 | 829.000 | 2.472% | 3.326% | 0.967% |
| 2007 | 890.000 | 7.358% | 3.486% | 1.029% |
| 2008 | 1,007.000 | 13.146% | 3.974% | 1.176% |
| 2009 | 1,170.000 | 16.187% | 4.472% | 1.367% |
| 2010 | 1,149.000 | -1.795% | 4.104% | 1.288% |
| 2011 | 1,216.000 | 5.831% | 4.212% | 1.353% |
| 2012 | 1,224.000 | 0.658% | 4.074% | 1.344% |
| 2013 | 1,244.000 | 1.634% | 4.045% | 1.347% |
| 2014 | 1,292.000 | 3.859% | 4.143% | 1.380% |
| 2015 | 1,340.000 | 3.715% | 4.140% | 1.405% |
Historical Energy Data about Singapore
Total Oil Supply
Total Consumption of Petroleum Products
Oil and Petroleum Products, Net Exports/Imports (-)
Dry Natural Gas Consumption
Dry Natural Gas, Net Exports/Imports (-)
Total Coal Consumption
Coal, Net Exports/Imports (-)
Total Electricity Net Generation
Total Electricity Net Consumption
Total Electricity Exports
Total Electricity Imports
Electricity, Net Exports/Imports (-)
Total Conventional Thermal Electricity Net Generation
Total Biofuels Production
Total Biofuels Consumption
Total Primary Energy Consumption
Total Carbon Dioxide Emissions from the Consumption of Energy
Population