| Business / Energy Data |
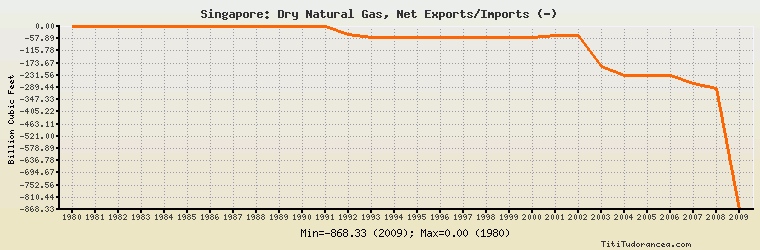
Singapore: Dry Natural Gas, Net Exports/Imports (-)
Billion Cubic Feet
| Year | Singapore | Change, percent | Singapore, percent of Asia & Oceania | Singapore, percent of World |
| 1980 | 0.000 | N/A | 0.00% | N/A |
| 1981 | 0.000 | 0.000% | 0.00% | N/A |
| 1982 | 0.000 | 0.000% | 0.00% | N/A |
| 1983 | 0.000 | 0.000% | 0.00% | N/A |
| 1984 | 0.000 | 0.000% | 0.00% | N/A |
| 1985 | 0.000 | 0.000% | 0.00% | N/A |
| 1986 | 0.000 | 0.000% | 0.00% | N/A |
| 1987 | 0.000 | 0.000% | 0.00% | N/A |
| 1988 | 0.000 | 0.000% | 0.00% | N/A |
| 1989 | 0.000 | 0.000% | 0.00% | N/A |
| 1990 | 0.000 | 0.000% | 0.00% | N/A |
| 1991 | 0.000 | 0.000% | 0.00% | N/A |
| 1992 | -39.000 | 0.000% | 15.294% | N/A |
| 1993 | -53.000 | 35.897% | 18.276% | N/A |
| 1994 | -53.000 | 0.000% | 16.208% | N/A |
| 1995 | -53.000 | 0.000% | 15.057% | N/A |
| 1996 | -53.000 | 0.000% | 14.171% | N/A |
| 1997 | -53.000 | 0.000% | 10.973% | N/A |
| 1998 | -53.000 | 0.000% | 9.925% | N/A |
| 1999 | -53.000 | 0.000% | 8.141% | N/A |
| 2000 | -53.000 | 0.000% | 5.856% | N/A |
| 2001 | -42.000 | -20.755% | 3.836% | N/A |
| 2002 | -41.000 | -2.381% | 3.073% | N/A |
| 2003 | -188.000 | 358.537% | 14.318% | N/A |
| 2004 | -233.000 | 23.936% | 14.974% | N/A |
| 2005 | -233.000 | 0.000% | 13.142% | N/A |
| 2006 | -233.000 | 0.000% | 10.170% | N/A |
| 2007 | -271.000 | 16.309% | 8.953% | N/A |
| 2008 | -292.000 | 7.749% | 9.502% | N/A |
| 2009 | -868.333 | 197.374% | 28.983% | N/A |
Historical Energy Data about Singapore
Total Oil Supply
Total Consumption of Petroleum Products
Oil and Petroleum Products, Net Exports/Imports (-)
Dry Natural Gas Consumption
Dry Natural Gas, Net Exports/Imports (-)
Total Coal Consumption
Coal, Net Exports/Imports (-)
Total Electricity Net Generation
Total Electricity Net Consumption
Total Electricity Exports
Total Electricity Imports
Electricity, Net Exports/Imports (-)
Total Conventional Thermal Electricity Net Generation
Total Biofuels Production
Total Biofuels Consumption
Total Primary Energy Consumption
Total Carbon Dioxide Emissions from the Consumption of Energy
Population