| Business / Energy Data |
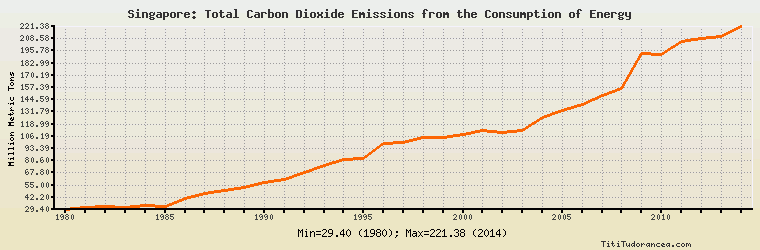
Singapore: Total Carbon Dioxide Emissions from the Consumption of Energy
Million Metric Tons
| Year | Singapore | Change, percent | Singapore, percent of Asia & Oceania | Singapore, percent of World |
| 1980 | 29.400 | N/A | 0.842% | 0.160% |
| 1981 | 31.000 | 5.442% | 0.878% | 0.171% |
| 1982 | 33.000 | 6.452% | 0.920% | 0.182% |
| 1983 | 32.000 | -3.030% | 0.867% | 0.176% |
| 1984 | 34.000 | 6.250% | 0.857% | 0.179% |
| 1985 | 33.000 | -2.941% | 0.806% | 0.170% |
| 1986 | 41.000 | 24.242% | 0.978% | 0.207% |
| 1987 | 46.000 | 12.195% | 1.045% | 0.226% |
| 1988 | 49.000 | 6.522% | 1.038% | 0.233% |
| 1989 | 53.000 | 8.163% | 1.094% | 0.249% |
| 1990 | 58.000 | 9.434% | 1.103% | 0.267% |
| 1991 | 61.000 | 5.172% | 1.176% | 0.286% |
| 1992 | 68.175 | 11.762% | 1.268% | 0.323% |
| 1993 | 75.918 | 11.358% | 1.335% | 0.357% |
| 1994 | 81.918 | 7.903% | 1.363% | 0.382% |
| 1995 | 82.918 | 1.221% | 1.300% | 0.378% |
| 1996 | 98.918 | 19.296% | 1.491% | 0.442% |
| 1997 | 99.918 | 1.011% | 1.497% | 0.445% |
| 1998 | 104.918 | 5.004% | 1.585% | 0.466% |
| 1999 | 104.918 | 0.000% | 1.510% | 0.458% |
| 2000 | 107.918 | 2.859% | 1.480% | 0.456% |
| 2001 | 112.334 | 4.092% | 1.501% | 0.471% |
| 2002 | 110.281 | -1.828% | 1.398% | 0.452% |
| 2003 | 112.452 | 1.969% | 1.300% | 0.439% |
| 2004 | 125.946 | 12.000% | 1.337% | 0.470% |
| 2005 | 133.627 | 6.099% | 1.307% | 0.480% |
| 2006 | 139.627 | 4.490% | 1.281% | 0.487% |
| 2007 | 148.925 | 6.659% | 1.294% | 0.507% |
| 2008 | 155.986 | 4.741% | 1.319% | 0.524% |
| 2009 | 192.811 | 23.608% | 1.537% | 0.652% |
| 2010 | 191.501 | -0.679% | 1.426% | 0.615% |
| 2011 | 205.766 | 7.449% | 1.419% | 0.636% |
| 2012 | 208.941 | 1.543% | 1.370% | 0.632% |
| 2013 | 210.888 | 0.932% | 1.332% | 0.626% |
| 2014 | 221.382 | 4.976% | 1.398% | 0.656% |
Historical Energy Data about Singapore
Total Oil Supply
Total Consumption of Petroleum Products
Oil and Petroleum Products, Net Exports/Imports (-)
Dry Natural Gas Consumption
Dry Natural Gas, Net Exports/Imports (-)
Total Coal Consumption
Coal, Net Exports/Imports (-)
Total Electricity Net Generation
Total Electricity Net Consumption
Total Electricity Exports
Total Electricity Imports
Electricity, Net Exports/Imports (-)
Total Conventional Thermal Electricity Net Generation
Total Biofuels Production
Total Biofuels Consumption
Total Primary Energy Consumption
Total Carbon Dioxide Emissions from the Consumption of Energy
Population