| Business / Energy Data |
Singapore: Total Oil Supply
Thousand Barrels Per Day
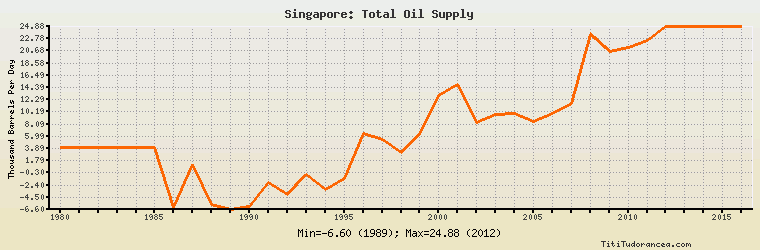
| Year | Singapore | Change, percent | Singapore, percent of Asia & Oceania | Singapore, percent of World |
| 1980 | 4.000 | N/A | 0.079% | 0.006% |
| 1981 | 4.000 | 0.000% | 0.079% | 0.007% |
| 1982 | 4.000 | 0.000% | 0.081% | 0.007% |
| 1983 | 4.000 | 0.000% | 0.076% | 0.007% |
| 1984 | 4.000 | 0.000% | 0.070% | 0.007% |
| 1985 | 4.000 | 0.000% | 0.067% | 0.007% |
| 1986 | -6.200 | -255.000% | -0.101% | -0.010% |
| 1987 | 1.100 | -117.742% | 0.018% | 0.002% |
| 1988 | -5.700 | -618.182% | -0.090% | -0.009% |
| 1989 | -6.600 | 15.789% | -0.101% | -0.010% |
| 1990 | -6.000 | -9.091% | -0.089% | -0.009% |
| 1991 | -1.900 | -68.333% | -0.027% | -0.003% |
| 1992 | -4.000 | 110.526% | -0.058% | -0.006% |
| 1993 | -0.600 | -85.000% | -0.009% | -0.001% |
| 1994 | -3.100 | 416.667% | -0.043% | -0.005% |
| 1995 | -1.200 | -61.290% | -0.016% | -0.002% |
| 1996 | 6.400 | -633.333% | 0.083% | 0.009% |
| 1997 | 5.400 | -15.625% | 0.068% | 0.007% |
| 1998 | 3.200 | -40.741% | 0.040% | 0.004% |
| 1999 | 6.300 | 96.875% | 0.078% | 0.008% |
| 2000 | 13.095 | 107.857% | 0.157% | 0.017% |
| 2001 | 14.956 | 14.212% | 0.180% | 0.019% |
| 2002 | 8.290 | -44.571% | 0.100% | 0.011% |
| 2003 | 9.701 | 17.021% | 0.117% | 0.012% |
| 2004 | 9.836 | 1.392% | 0.117% | 0.012% |
| 2005 | 8.573 | -12.841% | 0.100% | 0.010% |
| 2006 | 9.967 | 16.260% | 0.116% | 0.012% |
| 2007 | 11.608 | 16.464% | 0.134% | 0.014% |
| 2008 | 23.548 | 102.860% | 0.267% | 0.027% |
| 2009 | 20.579 | -12.608% | 0.231% | 0.024% |
| 2010 | 21.250 | 3.261% | 0.227% | 0.024% |
| 2011 | 22.500 | 5.882% | 0.241% | 0.025% |
| 2012 | 24.881 | 10.582% | 0.262% | 0.027% |
| 2013 | 24.881 | 0.000% | 0.262% | 0.027% |
| 2014 | 24.881 | 0.000% | 0.258% | 0.027% |
| 2015 | 24.881 | 0.000% | 0.254% | 0.026% |
| 2016 | 24.881 | 0.000% | 0.262% | 0.026% |
Historical Energy Data about Singapore
Total Oil Supply
Total Consumption of Petroleum Products
Oil and Petroleum Products, Net Exports/Imports (-)
Dry Natural Gas Consumption
Dry Natural Gas, Net Exports/Imports (-)
Total Coal Consumption
Coal, Net Exports/Imports (-)
Total Electricity Net Generation
Total Electricity Net Consumption
Total Electricity Exports
Total Electricity Imports
Electricity, Net Exports/Imports (-)
Total Conventional Thermal Electricity Net Generation
Total Biofuels Production
Total Biofuels Consumption
Total Primary Energy Consumption
Total Carbon Dioxide Emissions from the Consumption of Energy
Population