| Business / Exchange Rates |
GBP to MYR Exchange Rates:
(British Pound to Malaysian Ringgit)
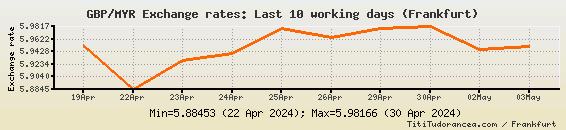
Last 10 working days
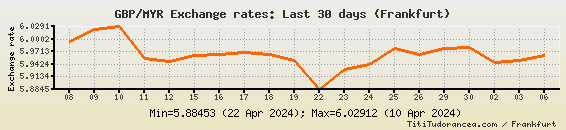
Last 30 days
Wednesday, April 24th - Thursday, April 25th: The upward trend continued for another two trading days, the GBP/MYR currency pair rising from 5.92934 to 5.97782.
Tuesday, April 23rd: The ascending trend started again - the pair went up by 0.04481.
Thursday, April 18th - Monday, April 22nd: The rate hit 5.88453 Malaysian ringgit a British pound, the lowest level in three months.
Tuesday, April 16th - Wednesday, April 17th: The upward trend continued and the GBP/MYR exchange ![]() gained to 5.96862, from 5.96277.
gained to 5.96862, from 5.96277.
Monday, April 15th: The Malaysian ringgit started to depreciate again against the British pound; the GBP/MYR exchange ![]() was up 0.01479.
was up 0.01479.
Thursday, April 11th - Friday, April 12th: The exchange ![]() decreased for two trading days in a row, reaching 5.94798 Malaysian ringgit to the British pound on Friday, April 12th.
decreased for two trading days in a row, reaching 5.94798 Malaysian ringgit to the British pound on Friday, April 12th.
Wednesday, April 10th: The British pound to Malaysian ringgit quotation rose again. A 0.00657 gain brought the ![]() to 6.02912. This was the peak
to 6.02912. This was the peak ![]() in six weeks.
in six weeks.
Tuesday, April 9th: The value of the Malaysian ringgit against the British currency started to decline again - the GBP/MYR exchange ![]() advanced to 6.02255.
advanced to 6.02255.
Monday, April 8th: A tiny decrease of 0.00585 brought the GBP/MYR quotation to 5.99394.
Thursday, April 4th - Friday, April 5th: The Malaysian ringgit continued to depreciate against the British pound for another two trading days, the GBP/MYR ![]() of exchange rising to 5.99979.
of exchange rising to 5.99979.
Wednesday, April 3rd: The Malaysian ringgit started to depreciate again against the British pound, the GBP/MYR exchange ![]() rising to 5.98194.
rising to 5.98194.
Tuesday, April 2nd: The British pound to Malaysian ringgit exchange rate decreased to 5.97661.
Wednesday, March 27th - Thursday, March 28th: The rate went up for two trading days in a row, reaching the level of 5.98386 Malaysian ringgit to the British pound on Thursday, March 28th.
Tuesday, March 26th: A 0.00553 loss brought the GBP/MYR cross from 5.97389 to 5.96836.
Last 365 days
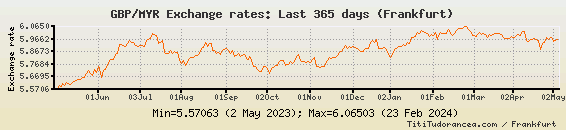
GBP/MYR Exchange rate - Historical data:
| Date: | Exchange rate: |
| 2024-04-25 | 5.97782 |
| 2024-04-24 | 5.94078 |
| 2024-04-23 | 5.92934 |
| 2024-04-22 | 5.88453 |
| 2024-04-19 | 5.95176 |
| 2024-04-18 | 5.96569 |
| 2024-04-17 | 5.96862 |
| 2024-04-16 | 5.96594 |
| 2024-04-15 | 5.96277 |
| 2024-04-12 | 5.94798 |
| 2024-04-11 | 5.95569 |
| 2024-04-10 | 6.02912 |
| 2024-04-09 | 6.02255 |
| 2024-04-08 | 5.99394 |
| 2024-04-05 | 5.99979 |
| 2024-04-04 | 5.99536 |
| 2024-04-03 | 5.98194 |
| 2024-04-02 | 5.97661 |
| 2024-03-28 | 5.98386 |
| 2024-03-27 | 5.96866 |
| 2024-03-26 | 5.96836 |
| 2024-03-25 | 5.97389 |
| 2024-03-22 | 5.97634 |
| 2024-03-21 | 6.00201 |
| 2024-03-20 | 6.0136 |
| 2024-03-19 | 6.01229 |
| 2024-03-18 | 6.00924 |
| 2024-03-15 | 5.99941 |
| 2024-03-14 | 5.99333 |
| 2024-03-13 | 6.00133 |
| 2024-03-12 | 5.97486 |
| 2024-03-11 | 6.00613 |
| 2024-03-08 | 6.01353 |
| 2024-03-07 | 5.99988 |
| 2024-03-06 | 6.01839 |
| 2024-03-05 | 6.00517 |
| 2024-03-04 | 5.98612 |
| 2024-03-01 | 5.99593 |
| 2024-02-29 | 5.9979 |
| 2024-02-28 | 6.02761 |
| 2024-02-27 | 6.03784 |
| 2024-02-26 | 6.06351 |
| 2024-02-23 | 6.06503 |
| 2024-02-22 | 6.04917 |
| 2024-02-21 | 6.05216 |
| 2024-02-20 | 6.04985 |
| 2024-02-19 | 6.037 |
| 2024-02-16 | 6.0132 |
| 2024-02-15 | 5.9979 |
| 2024-02-14 | 6.01363 |
| 2024-02-13 | 6.04468 |
| 2024-02-12 | 6.01281 |
| 2024-02-09 | 6.00761 |
| 2024-02-08 | 6.00974 |
| 2024-02-07 | 6.0143 |
| 2024-02-06 | 5.99064 |
| 2024-02-05 | 5.96402 |
| 2024-02-02 | 6.02043 |
| 2024-02-01 | 5.99276 |
| 2024-01-31 | 5.99977 |
| 2024-01-30 | 5.98799 |
| 2024-01-29 | 6.01009 |
| 2024-01-26 | 6.02017 |
| 2024-01-25 | 6.02539 |
| 2024-01-24 | 6.0317 |
| 2024-01-23 | 6.01125 |
The cross rates on this page are based on the Reference Exchange Rates published by the European Central Bank.
The reference rates are averages of buying and selling rates against the euro, calculated according to the daily concertation procedure between central banks within and outside the European System of Central Banks, by paying due attention to ensuring that the published exchange rates reflect the market conditions prevailing at the time of the daily concertation procedure.
Actual market transactions are affected by a number of factors, such as location and type of transaction (buying or selling), and might be carried at different rates. This data is released for reference purposes only.