| Business / Exchange Rates |
GBP to PHP Exchange Rates:
(British Pound to Philippine Peso)
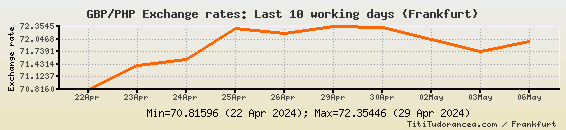
Last 10 working days
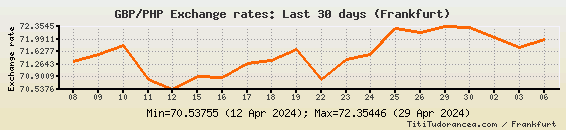
Last 30 days
Wednesday, April 24th - Thursday, April 25th: The ascending trend continued and the British pound to Philippine peso exchange rate rose to 72.29647. This was the highest level in eight months.
Tuesday, April 23rd: The ascending trend started again - the ![]() climbed by 0.58439.
climbed by 0.58439.
Monday, April 22nd: A sharp drop-off brought the British pound to Philippine peso exchange ![]() to 70.81596.
to 70.81596.
Thursday, April 18th - Friday, April 19th: The ascending course continued. The quote gained 0.39379 in two trading days, rising from 71.28689 to 71.68068.
Wednesday, April 17th: The British pound started to appreciate again against the Philippine currency, the British pound to Philippine peso quotation rising by 0.40557.
Tuesday, April 16th: The quotation went down, reaching 70.88132.
Monday, April 15th: The ![]() of exchange moved up to the 70.90686 level.
of exchange moved up to the 70.90686 level.
Thursday, April 11th - Friday, April 12th: The GBP/PHP quotation decreased to 70.53755, the lowest level in seven weeks.
Tuesday, April 9th - Wednesday, April 10th: The exchange ![]() went up to 71.80962.
went up to 71.80962.
Monday, April 8th: The British pound to Philippine peso quotation declined to the 71.33749 level.
Thursday, April 4th - Friday, April 5th: The upward trend continued and the exchange rate gained to 71.4304, from 70.95423.
Wednesday, April 3rd: The British pound started to rise again against the Philippine currency; the quote was up 0.19525.
Tuesday, April 2nd: A 0.34031 depreciation brought the GBP/PHP cross to 70.75898.
Thursday, March 28th: The quotation rose by 0.15325, to 71.09929.
Wednesday, March 27th: The GBP/PHP quote declined slightly, to 70.94604.
Tuesday, March 26th: An up-tick brought the rate to 71.12154.
Last 365 days
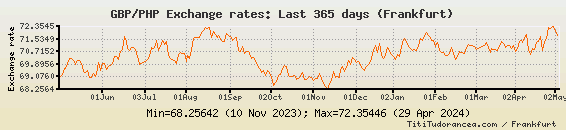
GBP/PHP Exchange rate - Historical data:
| Date: | Exchange rate: |
| 2024-04-25 | 72.29647 |
| 2024-04-24 | 71.54227 |
| 2024-04-23 | 71.40035 |
| 2024-04-22 | 70.81596 |
| 2024-04-19 | 71.68068 |
| 2024-04-18 | 71.3867 |
| 2024-04-17 | 71.28689 |
| 2024-04-16 | 70.88132 |
| 2024-04-15 | 70.90686 |
| 2024-04-12 | 70.53755 |
| 2024-04-11 | 70.82958 |
| 2024-04-10 | 71.80962 |
| 2024-04-09 | 71.56065 |
| 2024-04-08 | 71.33749 |
| 2024-04-05 | 71.4304 |
| 2024-04-04 | 71.38877 |
| 2024-04-03 | 70.95423 |
| 2024-04-02 | 70.75898 |
| 2024-03-28 | 71.09929 |
| 2024-03-27 | 70.94604 |
| 2024-03-26 | 71.12154 |
| 2024-03-25 | 71.08684 |
| 2024-03-22 | 71.01579 |
| 2024-03-21 | 71.23532 |
| 2024-03-20 | 71.37105 |
| 2024-03-19 | 71.06443 |
| 2024-03-18 | 70.8097 |
| 2024-03-15 | 70.82777 |
| 2024-03-14 | 70.83002 |
| 2024-03-13 | 70.89794 |
| 2024-03-12 | 70.66278 |
| 2024-03-11 | 70.9992 |
| 2024-03-08 | 71.34135 |
| 2024-03-07 | 71.14986 |
| 2024-03-06 | 71.03207 |
| 2024-03-05 | 70.99003 |
| 2024-03-04 | 70.95334 |
| 2024-03-01 | 70.88844 |
| 2024-02-29 | 71.05014 |
| 2024-02-28 | 71.10277 |
| 2024-02-27 | 71.13058 |
| 2024-02-26 | 71.20182 |
| 2024-02-23 | 70.96555 |
| 2024-02-22 | 70.57985 |
| 2024-02-21 | 70.63853 |
| 2024-02-20 | 70.69344 |
| 2024-02-19 | 70.69797 |
| 2024-02-16 | 70.39075 |
| 2024-02-15 | 70.17691 |
| 2024-02-14 | 70.56698 |
| 2024-02-13 | 70.97464 |
| 2024-02-12 | 70.62805 |
| 2024-02-09 | 70.47636 |
| 2024-02-08 | 70.44906 |
| 2024-02-07 | 70.68988 |
| 2024-02-06 | 70.64826 |
| 2024-02-05 | 70.76114 |
| 2024-02-02 | 71.3381 |
| 2024-02-01 | 71.05198 |
| 2024-01-31 | 71.42623 |
| 2024-01-30 | 71.43808 |
| 2024-01-29 | 71.61642 |
| 2024-01-26 | 71.78334 |
| 2024-01-25 | 71.96334 |
| 2024-01-24 | 71.73235 |
| 2024-01-23 | 71.46901 |
The cross rates on this page are based on the Reference Exchange Rates published by the European Central Bank.
The reference rates are averages of buying and selling rates against the euro, calculated according to the daily concertation procedure between central banks within and outside the European System of Central Banks, by paying due attention to ensuring that the published exchange rates reflect the market conditions prevailing at the time of the daily concertation procedure.
Actual market transactions are affected by a number of factors, such as location and type of transaction (buying or selling), and might be carried at different rates. This data is released for reference purposes only.