| Business / Energy Data |
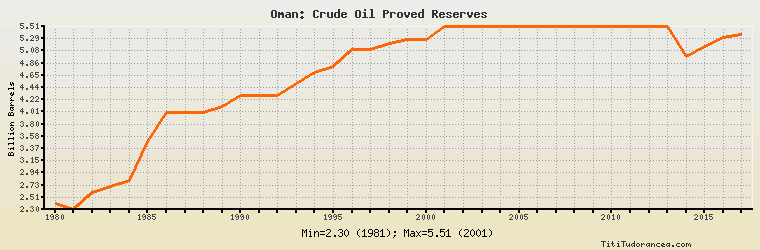
Oman: Crude Oil Proved Reserves
Billion Barrels
| Year | Oman | Change, percent | Oman, percent of Middle East | Oman, percent of World |
| 1980 | 2.400 | N/A | 0.664% | 0.374% |
| 1981 | 2.300 | -4.167% | 0.635% | 0.353% |
| 1982 | 2.600 | 13.043% | 0.716% | 0.388% |
| 1983 | 2.700 | 3.846% | 0.734% | 0.406% |
| 1984 | 2.800 | 3.704% | 0.757% | 0.420% |
| 1985 | 3.500 | 25.000% | 0.876% | 0.499% |
| 1986 | 4.000 | 14.286% | 1.007% | 0.573% |
| 1987 | 4.000 | 0.000% | 0.995% | 0.573% |
| 1988 | 4.000 | 0.000% | 0.707% | 0.450% |
| 1989 | 4.100 | 2.500% | 0.716% | 0.452% |
| 1990 | 4.300 | 4.878% | 0.651% | 0.429% |
| 1991 | 4.300 | 0.000% | 0.649% | 0.430% |
| 1992 | 4.300 | 0.000% | 0.650% | 0.461% |
| 1993 | 4.500 | 4.651% | 0.680% | 0.479% |
| 1994 | 4.700 | 4.444% | 0.709% | 0.499% |
| 1995 | 4.800 | 2.128% | 0.727% | 0.509% |
| 1996 | 5.100 | 6.250% | 0.773% | 0.536% |
| 1997 | 5.100 | 0.000% | 0.753% | 0.499% |
| 1998 | 5.200 | 1.961% | 0.766% | 0.508% |
| 1999 | 5.283 | 1.596% | 0.784% | 0.511% |
| 2000 | 5.283 | 0.000% | 0.782% | 0.519% |
| 2001 | 5.506 | 4.221% | 0.806% | 0.535% |
| 2002 | 5.506 | 0.000% | 0.803% | 0.533% |
| 2003 | 5.506 | 0.000% | 0.803% | 0.453% |
| 2004 | 5.506 | 0.000% | 0.758% | 0.435% |
| 2005 | 5.506 | 0.000% | 0.755% | 0.431% |
| 2006 | 5.506 | 0.000% | 0.746% | 0.427% |
| 2007 | 5.500 | -0.109% | 0.742% | 0.417% |
| 2008 | 5.500 | 0.000% | 0.740% | 0.414% |
| 2009 | 5.500 | 0.000% | 0.742% | 0.412% |
| 2010 | 5.500 | 0.000% | 0.731% | 0.405% |
| 2011 | 5.500 | 0.000% | 0.731% | 0.373% |
| 2012 | 5.500 | 0.000% | 0.692% | 0.361% |
| 2013 | 5.500 | 0.000% | 0.690% | 0.335% |
| 2014 | 4.974 | -9.564% | 0.623% | 0.301% |
| 2015 | 5.151 | 3.559% | 0.641% | 0.311% |
| 2016 | 5.306 | 3.009% | 0.661% | 0.321% |
| 2017 | 5.373 | 1.263% | 0.669% | N/A |
Historical Energy Data about Oman
Total Oil Supply
Total Consumption of Petroleum Products
Oil and Petroleum Products, Net Exports/Imports (-)
Production of Crude Oil including Lease Condensate
Crude Oil Proved Reserves
Dry Natural Gas Production
Dry Natural Gas Consumption
Dry Natural Gas, Net Exports/Imports (-)
Proved Reserves of Natural Gas
Coal, Net Exports/Imports (-)
Total Electricity Net Generation
Total Electricity Net Consumption
Electricity, Net Exports/Imports (-)
Total Conventional Thermal Electricity Net Generation
Total Primary Energy Production
Total Primary Energy Consumption
Total Carbon Dioxide Emissions from the Consumption of Energy
Population