| Business / Energy Data |
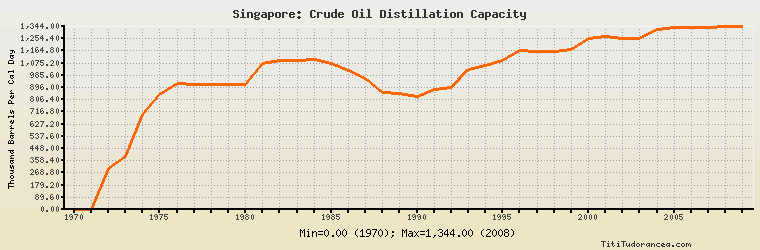
Singapore: Crude Oil Distillation Capacity
Thousand Barrels Per Cal Day
| Year | Singapore | Change, percent | Singapore, percent of Asia & Oceania | Singapore, percent of World |
| 1970 | 0.000 | N/A | 0.00% | 0.00% |
| 1971 | 0.000 | 0.000% | 0.00% | 0.00% |
| 1972 | 299.000 | 0.000% | 4.088% | 0.546% |
| 1973 | 390.000 | 30.435% | 4.641% | 0.674% |
| 1974 | 700.000 | 79.487% | 7.351% | 1.116% |
| 1975 | 846.000 | 20.857% | 8.267% | 1.280% |
| 1976 | 923.000 | 9.102% | 8.491% | 1.328% |
| 1977 | 918.000 | -0.542% | 8.009% | 1.270% |
| 1978 | 918.000 | 0.000% | 7.887% | 1.229% |
| 1979 | 918.000 | 0.000% | 7.692% | 1.214% |
| 1980 | 921.000 | 0.327% | 7.640% | 1.199% |
| 1981 | 1,069.000 | 16.069% | 8.599% | 1.362% |
| 1982 | 1,096.000 | 2.526% | 8.533% | 1.412% |
| 1983 | 1,096.000 | 0.000% | 8.455% | 1.477% |
| 1984 | 1,101.000 | 0.456% | 8.751% | 1.524% |
| 1985 | 1,072.000 | -2.634% | 8.503% | 1.488% |
| 1986 | 1,018.000 | -5.037% | 8.227% | 1.466% |
| 1987 | 961.000 | -5.599% | 7.600% | 1.384% |
| 1988 | 858.000 | -10.718% | 6.854% | 1.218% |
| 1989 | 852.000 | -0.699% | 6.948% | 1.217% |
| 1990 | 830.000 | -2.582% | 6.814% | 1.176% |
| 1991 | 878.000 | 5.783% | 6.989% | 1.219% |
| 1992 | 893.000 | 1.708% | 6.768% | 1.184% |
| 1993 | 1,029.000 | 15.230% | 7.682% | 1.407% |
| 1994 | 1,055.000 | 2.527% | 7.724% | 1.444% |
| 1995 | 1,091.000 | 3.412% | 7.567% | 1.469% |
| 1996 | 1,170.000 | 7.241% | 7.904% | 1.573% |
| 1997 | 1,157.000 | -1.111% | 7.104% | 1.523% |
| 1998 | 1,157.000 | 0.000% | 6.808% | 1.483% |
| 1999 | 1,172.000 | 1.296% | 6.243% | 1.463% |
| 2000 | 1,255.000 | 7.082% | 6.389% | 1.539% |
| 2001 | 1,270.000 | 1.195% | 6.298% | 1.562% |
| 2002 | 1,259.000 | -0.866% | 6.238% | 1.546% |
| 2003 | 1,259.000 | 0.000% | 6.231% | 1.535% |
| 2004 | 1,319.000 | 4.766% | 6.582% | 1.603% |
| 2005 | 1,337.000 | 1.365% | 6.460% | 1.615% |
| 2006 | 1,337.000 | 0.000% | 6.021% | 1.567% |
| 2007 | 1,337.000 | 0.000% | 5.993% | 1.566% |
| 2008 | 1,344.000 | 0.524% | 6.050% | 1.573% |
| 2009 | 1,344.000 | 0.000% | 5.978% | 1.565% |
| 2010 | N/A | N/A | N/A | N/A |
Historical Energy Data about Singapore
Total Oil Supply
Total Consumption of Petroleum Products
Oil and Petroleum Products, Net Exports/Imports (-)
Dry Natural Gas Consumption
Dry Natural Gas, Net Exports/Imports (-)
Total Coal Consumption
Coal, Net Exports/Imports (-)
Total Electricity Net Generation
Total Electricity Net Consumption
Total Electricity Exports
Total Electricity Imports
Electricity, Net Exports/Imports (-)
Total Conventional Thermal Electricity Net Generation
Total Biofuels Production
Total Biofuels Consumption
Total Primary Energy Consumption
Total Carbon Dioxide Emissions from the Consumption of Energy
Population