| Business / Exchange Rates |
CAD to JPY Exchange Rates:
(Canadian Dollar to Japanese Yen)
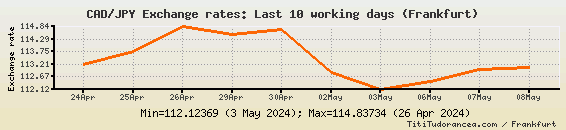
Last 10 working days
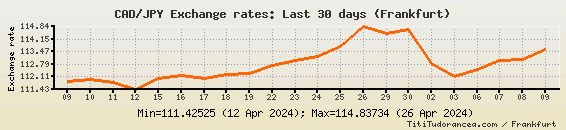
Last 30 days
Thursday, April 18th - Friday, April 26th: The Canadian dollar to Japanese yen quotation went up for seven trading days in a row, reaching 114.83734. This was the highest level since December 2007.
Wednesday, April 17th: The CAD/JPY currency pair declined slightly, to 112.00054.
Monday, April 15th - Tuesday, April 16th: The rate climbed for two consecutive trading days, reaching the level of 112.17617 Japanese yen to the Canadian dollar on Tuesday, April 16th.
Thursday, April 11th - Friday, April 12th: The ![]() of exchange decreased for two consecutive trading days, reaching the level of 111.42525 on Friday, April 12th.
of exchange decreased for two consecutive trading days, reaching the level of 111.42525 on Friday, April 12th.
Monday, April 8th - Wednesday, April 10th: The rate increased by a total of 0.33935, to 111.95682.
Friday, April 5th: A 0.78357 decrease brought the CAD/JPY exchange rate to 111.61747.
Thursday, March 28th - Thursday, April 4th: The Canadian dollar to Japanese yen quotation increased by a total of 1.25368, to 112.40104.
Wednesday, March 27th: A moderate decrease of 0.5526 brought the quotation to 111.14736. This was the lowest reading since March 19th, 2024.
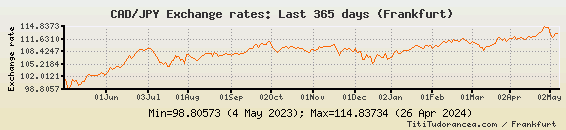
Last 365 days
CAD/JPY Exchange rate - Historical data:
| Date: | Exchange rate: |
| 2024-04-26 | 114.83734 |
| 2024-04-25 | 113.75947 |
| 2024-04-24 | 113.18704 |
| 2024-04-23 | 112.99323 |
| 2024-04-22 | 112.73986 |
| 2024-04-19 | 112.28692 |
| 2024-04-18 | 112.22169 |
| 2024-04-17 | 112.00054 |
| 2024-04-16 | 112.17617 |
| 2024-04-15 | 112.01775 |
| 2024-04-12 | 111.42525 |
| 2024-04-11 | 111.77832 |
| 2024-04-10 | 111.95682 |
| 2024-04-09 | 111.85165 |
| 2024-04-08 | 111.74312 |
| 2024-04-05 | 111.61747 |
| 2024-04-04 | 112.40104 |
| 2024-04-03 | 111.89662 |
| 2024-04-02 | 111.82685 |
| 2024-03-28 | 111.40267 |
| 2024-03-27 | 111.14736 |
| 2024-03-26 | 111.69996 |
| 2024-03-25 | 111.24847 |
| 2024-03-22 | 111.47876 |
| 2024-03-21 | 111.94354 |
| 2024-03-20 | 111.65852 |
| 2024-03-19 | 110.63181 |
| 2024-03-18 | 110.21363 |
| 2024-03-15 | 109.99253 |
| 2024-03-14 | 109.81324 |
| 2024-03-13 | 109.67064 |
| 2024-03-12 | 109.49861 |
| 2024-03-11 | 108.74398 |
| 2024-03-08 | 109.50956 |
| 2024-03-07 | 109.54777 |
| 2024-03-06 | 110.13541 |
| 2024-03-05 | 110.53774 |
| 2024-03-04 | 110.89069 |
| 2024-03-01 | 110.92036 |
| 2024-02-29 | 110.4219 |
| 2024-02-28 | 110.87889 |
| 2024-02-27 | 111.2901 |
| 2024-02-26 | 111.33978 |
| 2024-02-23 | 111.68163 |
| 2024-02-22 | 111.58845 |
| 2024-02-21 | 110.90436 |
| 2024-02-20 | 111.37206 |
| 2024-02-19 | 111.27255 |
| 2024-02-16 | 111.50296 |
| 2024-02-15 | 110.85447 |
| 2024-02-14 | 111.15859 |
| 2024-02-13 | 111.06747 |
| 2024-02-12 | 110.66602 |
| 2024-02-09 | 111.14179 |
| 2024-02-08 | 110.68597 |
| 2024-02-07 | 110.13723 |
| 2024-02-06 | 109.84442 |
| 2024-02-05 | 110.09857 |
| 2024-02-02 | 109.63177 |
| 2024-02-01 | 109.29593 |
| 2024-01-31 | 110.03572 |
| 2024-01-30 | 109.83933 |
| 2024-01-29 | 110.11553 |
| 2024-01-26 | 109.96098 |
| 2024-01-25 | 109.29047 |
| 2024-01-24 | 109.38714 |
The cross rates on this page are based on the Reference Exchange Rates published by the European Central Bank.
The reference rates are averages of buying and selling rates against the euro, calculated according to the daily concertation procedure between central banks within and outside the European System of Central Banks, by paying due attention to ensuring that the published exchange rates reflect the market conditions prevailing at the time of the daily concertation procedure.
Actual market transactions are affected by a number of factors, such as location and type of transaction (buying or selling), and might be carried at different rates. This data is released for reference purposes only.